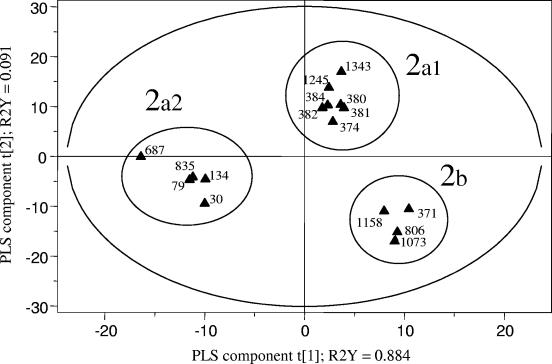
FIG. 3.
PLS discrimination between PFGE profiles of avian E. coli strains of different geographical origins. The R2Y coefficients correspond to the part of the variation of the Y matrix, as explained by the PLS components, and the explanatory performance of the model is evaluated by adding the R2Y coefficients. The cross-validation led to two PLS components, represented here as t[1] and t[2]. The corresponding PLS model explained 97.5% of the variation of the Y matrix. The 95% probability region defined by the model is delimited by the ellipse. The 2a group of cdt-positive strains could be subdivided into two subgroups, according to the geographical origins of the strain: 2a1, avian cdt-positive strains from Spain, and 2a2, cdt-positive strains from France and Belgium. The 2b group comprised cdt-negative strains from Spain only.

