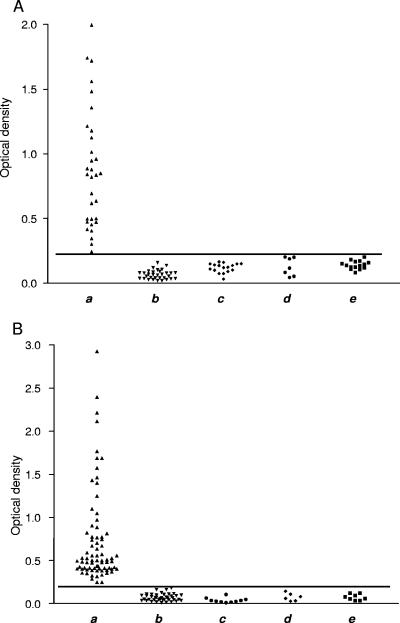
FIG. 6.
Optical density values obtained by performing ELISA with several serum groups. Horizontal lines correspond to calculated cutoff values. (A) Results obtained for the chimera by assaying the Ch+, Ch−, AID, and L serum groups. Columns a and b show results for Chagas' disease-positive and Chagas' disease-negative sera, respectively, columns c and d show results for the AID serum group for SLE and RA sera, respectively, and column e shows results for the L serum group. (B) Results obtained for the chimera when assaying additional control serum samples and the ID serum group. Columns a and b show results for 72 Chagas' disease-positive and 35 Chagas' disease-negative control serum samples, respectively, columns c, d, and e show ID group results for sera of patients infected with Toxoplasma gondii, Brucella abortus, and Streptococcus pyogenes, respectively.

