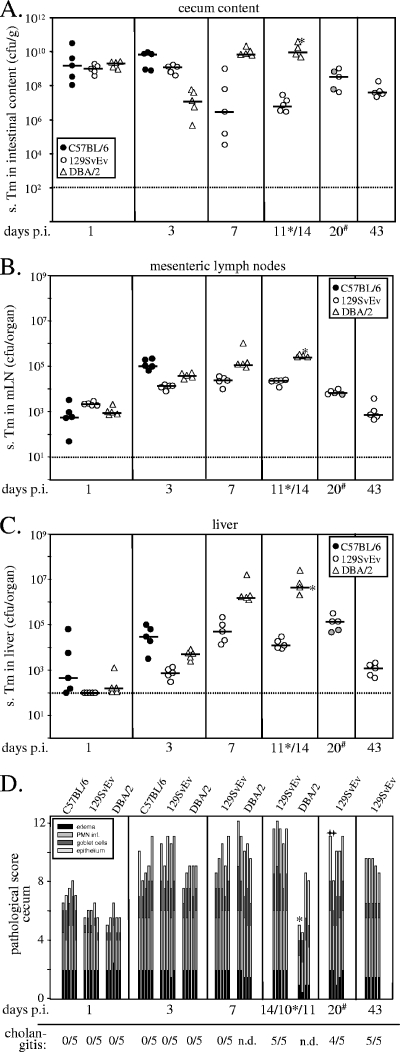
FIG. 3.
Time course of serovar Typhimurium infection in streptomycin-pretreated C57BL/6, 129Sv/Ev, and DBA/2 mice. Five streptomycin-pretreated C57BL/6 mice per group were infected intragastrically with 5 × 10⁷ CFU wild-type serovar Typhimurium for 1 and 3 days. Five streptomycin-pretreated DBA/2 mice per group were infected intragastrically with 5 × 10⁷ CFU wild-type serovar Typhimurium for 1, 3, 7, and 10 or 11 days. Five streptomycin-pretreated 129Sv/Ev mice per group were infected intragastrically with 5 × 10⁷ CFU wild-type serovar Typhimurium for 1, 3, 7, 14, 20, and 43 days. (A) Bacterial loads in the cecal contents; (B) bacterial loads in the mLN; (C) bacterial loads in the liver. Solid circles, C57BL/6; open circles, 129Sv/Ev; triangles, DBA/2. Dotted line, limit of detection. (D) Histopathological analyses. HE-stained sections of cecal tissue were scored with respect to edema in the submucosa (black), PMN infiltration (medium gray), reduction in the number of goblet cells (dark gray), and desquamation/erosion/ulceration of the epithelial layer (light gray) (see Materials and Methods). Scores were plotted as stacked vertical bars. The incidence of cholangitis (expressed as number of animals with cholangitis/total number of animals in the group) is indicated at the bottom. Asterisks indicate the DBA/2 animal killed at day 10 p.i. The two 129Sv/Ev animals from the second independent experiment are marked with light gray circles (A to C) or plus signs (D). s. Tm, serovar Typhimurium.

