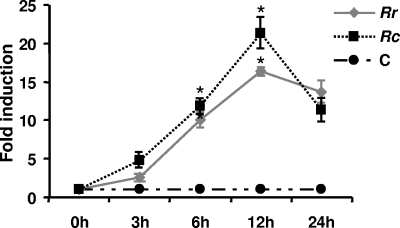
FIG. 2.
Densitometric data obtained from immunoblot analyses using COX-2-specific antibody and normalized for loading variations by stripping and probing of the blots with a monoclonal anti-tubulin antibody (n ≥ 3) were plotted as mean levels of induction ± standard errors relative to the control (C). Rr, R. rickettsii; Rc, R. conorii. *, P ≤ 0.05.

