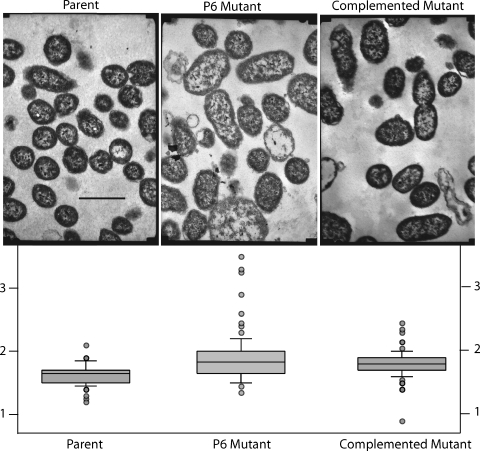
FIG. 5.
Electron micrographs of parent strain 49P5H1, P6 mutant, and complemented mutant. Bar, 1 μm. The graphs indicate the smallest diameters of 100 cells of each strain. The boxes denote 25 and 75% quartiles around the means, and the bars denote 10 and 90% values. Cell diameters lying outside the 10 and 90% values are noted by circles. The y axis shows the cell diameters measured on prints at a magnification of 20,000, in cm.

