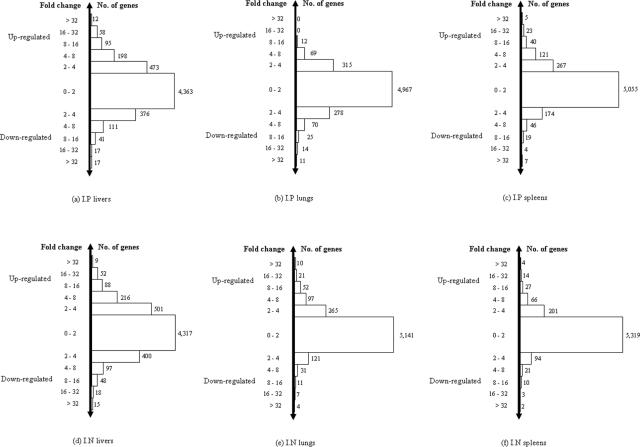
FIG. 1.
Genes grouped according to expression levels (changes [n-fold]) from six organ infection models (i.p. infected liver, i.p. infected lung, i.p. infected spleen, i.n. infected liver, i.n. infected lung, and i.n. infected spleen). The highest numbers of up- or down-regulated genes were from infected livers (a and d) for both routes of infection.

