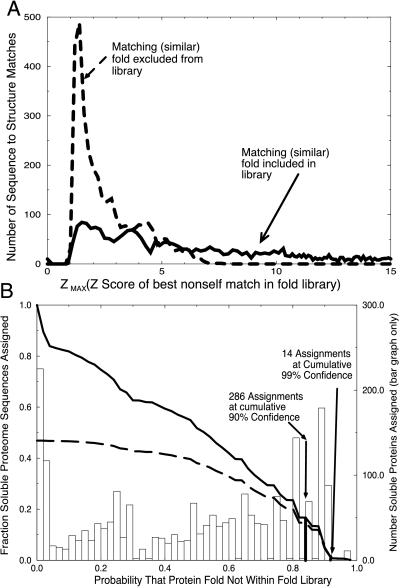
Figure 2.
(A) Distribution of Z-max scores for similar folds included (solid line) and excluded (dashed line) from the fold library. Two distributions of maximum nonself Z-scores were obtained: one where a similar fold exists in the training set, and a second where similar structures have been excluded from the library. The separation between these two distributions shows that the Z-max score is a good indicator of the presence of similar folds in the library. (B) Probability of correct novel fold assignment for fraction of genome proteins assigned. The probability of a novel fold was determined for each soluble ORF product of PA. The bar chart shows the number of ORFs predicted to have novel folds as a function of probability value. The fraction of the genome predicted to be novel as a function of probability value is given by the solid curve obtained by summing the bar chart. A sum of the bar chart, weighted by probability value, shows the cumulative number of accurate predictions as a function of probability value (dashed line).

