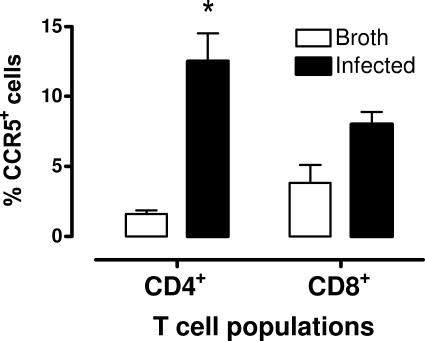
FIG. 6.
Increase in CCR5-expressing Th cells in lungs of mycoplasma-infected mice. C3H/HeN mice were infected with mycoplasmas, and 14 days later, lung cells were isolated and stained for CD4 (Th), CD8, and CCR5 and analyzed by flow cytometry. Shown are the populations of CD4+ Th and CD8+ T cells and the percentage of CCR5+ cells in each T-cell population in uninfected and infected lungs. Vertical bars represent mean ± the SE (n = 3). An asterisk denotes a statistical difference (P ≤ 0.05) compared to uninfected mice.

