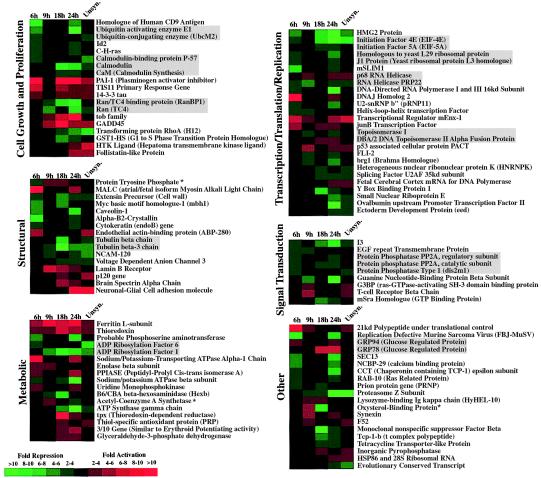
Figure 2.
Genes displaying differential expression in ts13 cells at 39.5°C. The expression pattern observed for each gene at the indicated time-points (6, 9, 18, and 24 hours) when cells were harvested after incubation at the restrictive temperature is shown. “Unsyn.” represents unsynchronized growing cells that were placed at the restrictive temperature for 24 hours. For each gene, the ratio of expression in ts13 cells compared with BHK-21 cells is represented in color according to the key. Gene identifications that are boxed in gray represent gene groups that are functionally related. An asterisk (*) after the gene identification indicates a gene whose expression is both decreased and increased at different times in ts13 cells relative to BHK-21 cells.

