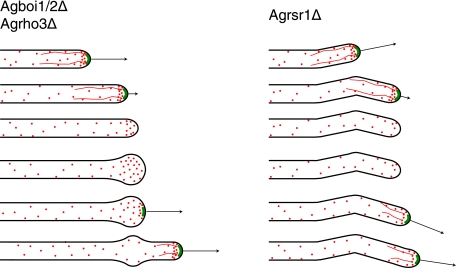
FIG. 8.
Schematic comparison of polarisome loss in Agrsr1Δ, Agboi1/2Δ, and Agrho3Δ strains. The contours of hyphae are depicted in black, the polarisome is depicted in green, actin cables are depicted as red lines, and actin patches are depicted as red dots. Arrows indicate the growth speed of hyphae. The developmental pattern is given in descending order. The initial pattern with the first three hyphae is comparable between Agrsr1Δ and Agboi1/2Δ/Agrho3Δ. In Agboi1/2Δ/Agrho3Δ the hyphal tip enlarges, which is not observed for Agrsr1Δ. Repolarization in Agboi1/2Δ and Agrho3Δ maintains the axis of growth, whereas in Agrsr1Δ resumption of growth occurred in a frequently uncoordinated manner to the previous axis of polarity.

