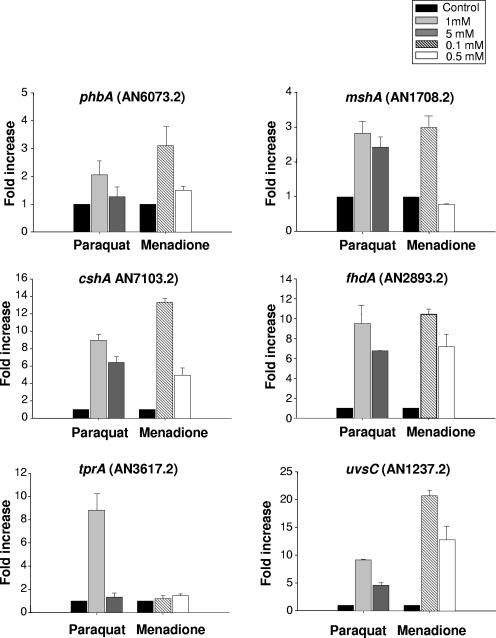
FIG. 7.
Expression of phbA, mshA, cshA, fhdA, tprA, and uvsC mRNAs when A. nidulans is exposed to different oxidative stress agents. The wild-type strain was grown in YG medium for 16 h at 37°C and then transferred to YG, YG plus PARAQ (1 or 5 mM), or YG plus MENA (0.1 or 0.5 mM) for 60 min. RNA was extracted and DNase treated, and RT-PCRs were run. The measured quantity of each gene mRNA in each of the treated samples was normalized using the cycle threshold values obtained for the tubC RNA amplifications run in the same plate. The relative quantitation of each gene and tubulin gene expression was determined by a standard curve (i.e., cycle threshold values plotted against logarithm of the DNA copy number). Results of four sets of experiments were combined for each determination; means ± standard deviations are shown. The values represent the number of times that the genes are expressed compared to that for the wild type or the ΔuvsB mutant grown without any drug (represented absolutely as 1.00).

