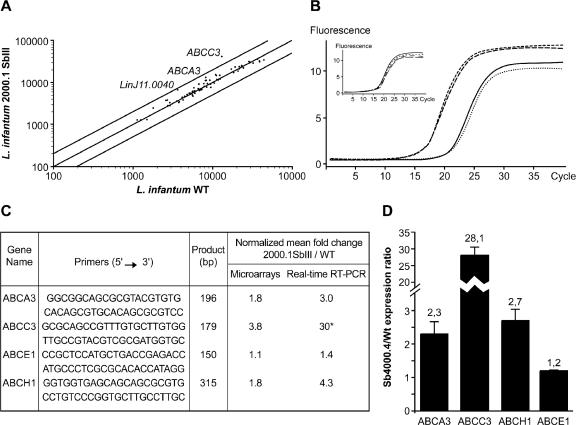
FIG. 6.
ABC gene expression in L. infantum antimony resistant mutants. (A) Scatter plot of hybridization intensities representing the average of four independent experiments between L. infantum WT and L. infantum Sb2000.1. The external lines indicate twofold differences, and genes whose expression differs significantly are indicated. The expression of genes represented by dots within the two external lines is considered similar in the two tested conditions, unless indicated otherwise. (B) Real-time PCR fluorescence curves representing duplicates of the MRPA gene amplification in the WT strain (dotted and full lines) and the Sb2000.1 strain (dashed and broken lines). The amplification curve of the GAPDH gene used for normalization is shown in the insert. (C) Validation of microarrays data by real-time RT-PCR. The gene ABCE1 was not found to be differentially expressed by microarrays and was used as a negative control. *, The curve for the gene was outside the standard curve, and the fold difference could be underestimated. A mean of four independent experiments is shown for microarrays, and a mean of two independent experiments is shown for real-time RT-PCR. (D) Real-time RT-PCR expression analysis of four ABC genes in L. infantum Sb4000.4 antimony-resistant mutant. The expression ratios of four ABC genes in the Sb4000.4 antimony-resistant mutant relative to the WT antimony-sensitive strain are shown. Results are a mean of three independent experiments performed from three different RNA preparations.

