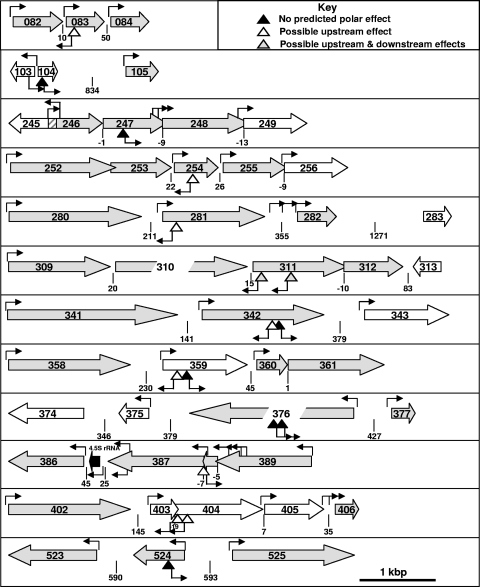
FIG. 5.
Schematic diagram of disrupted loci for selected SGA mutants to assess the likelihood of polar consequences of transposon insertions. ORFs (8) are indicated by large open arrows, with gray and white indicating the reported presence or absence, respectively, of the protein product in the M. pneumoniae proteome (22, 46). ORF overlap is indicated by overlapping arrows, except for MPN245/MPN246 overlap, which is cross-hatched. The spacing between ORFs is indicated below each locus. Inverted triangles correspond to transposon insertions, with predicted polar effects as detailed in the key. Small arrows originating from the inverted triangles indicate the orientation of a promoter in IS256 that is functional in M. pneumoniae (5). Other small arrows indicate the location and orientation of predicted promoters based upon the consensus sequence TAxxxT (51, 52). Scale is approximate, as indicated at the bottom of the diagram.

