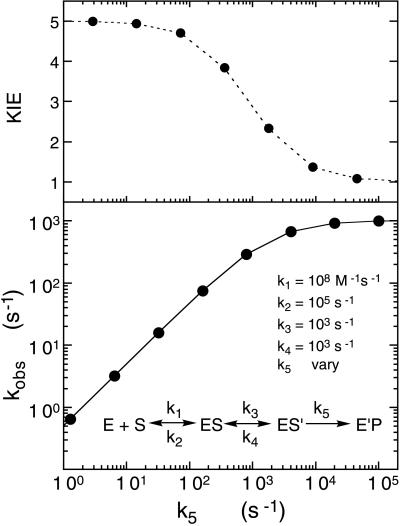
Figure 6.
Computer simulation for the relation of the observed rate constant for flavin reduction versus the intrinsic rate constant, k5, for the model shown, where the second equilibrium step provides a limit to the rate at which substrate is able to position itself in the enzyme active site in the optimal position for reduction to occur. The calculated values shown in the lower graph are for a progression of 5-fold increases in the value of k5. The top graph shows the expected isotope effect for each 5-fold change of k5. Thus, full isotope effects are exhibited at values of k5 below that of k3, but decrease to zero as the value of k5 becomes larger than that of k3.

