FIG. 3.
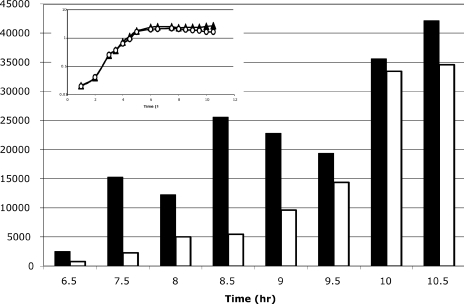
RT-PCR analysis of gerE transcript levels. AWS144 (citB+; triangles) and AWS133 (citB5; circles) were grown in DSM at 37°C (inset). Samples were isolated at the time points indicated. RNA was prepared, and cDNA was synthesized with reverse primers to rrnA-16S and gerE. Eighteen cycles of amplification was determined to be within the linear range for PCR of rrnA-16S. The linear range for PCR of gerE was determined for each sample; 48 to 50 cycles were used for time points 6.5 to 8.5, and 35 cycles were used for time points 9 to 10.5. The rrnA-16S PCRs were done in duplicate for each sample. After product quantitation, the pixel numbers were averaged and normalized by determining the ratio of each sample to the wild-type rrnA-16S (h 6.5 sample). Then, all gerE transcripts were normalized to the rrnA-16S product from the same time point by determining the ratio of gerE product to the normalized rrnA-16S product. Relative gerE transcripts for AWS144 (citB+; solid bars) and AWS133 (citB5; empty bars) are shown for each time point.

