Abstract
Biological mineralization of tissues in living organisms relies on proteins that preferentially nucleate minerals and control their growth. This process is often referred to as “templating,” but this term has become generic, denoting various proposed mineral–organic interactions including both chemical and structural affinities. Here, we present an approach using self-assembled networks of elastin and fibronectin fibers, similar to the extracellular matrix. When induced onto negatively charged sulfonated polystyrene surfaces, these proteins form fiber networks of ≈10-μm spacing, leaving open regions of disorganized protein between them. We introduce an atomic force microscopy-based technique to measure the elastic modulus of both structured and disorganized protein before and during calcium carbonate mineralization. Mineral-induced thickening and stiffening of the protein fibers during early stages of mineralization is clearly demonstrated, well before discrete mineral crystals are large enough to image by atomic force microscopy. Calcium carbonate stiffens the protein fibers selectively without affecting the regions between them, emphasizing interactions between the mineral and the organized protein fibers. Late-stage observations by optical microscopy and secondary ion mass spectroscopy reveal that Ca is concentrated along the protein fibers and that crystals form preferentially on the fiber crossings. We demonstrate that organized versus unstructured proteins can be assembled mere nanometers apart and probed in identical environments, where mineralization is proved to require the structural organization imposed by fibrillogenesis of the extracellular matrix.
Keywords: calcium carbonate, elastic modulus, extracellular matrix, secondary ion mass spectroscopy
Biomineralization is the process by which living organisms build inorganic mineral-based structures. This process has been of vital interest for over a century, because nature is known to produce mineral architectures, which exhibit superior mechanical strength and other specialized properties. Understanding and mimicking this process is critical to “biomimetic” materials science for inorganic–organic hybrid materials (bio-ceramics), low-temperature materials for electronics and semiconductor applications, and medical engineering of bone, teeth, and cartilage (1–6). A large body of literature already exists describing the process, but even the most recent reviews emphasize the diversity of biominerals rather than the shared underlying mechanisms (7–9). Yet to understand the fundamental processes leading to biomineralization, we must first focus on the phenomena that many systems have in common. Arguably it is the very early stages of tissue organization and mineral nucleation that are the most general, after which specific controls of mineral growth allow differentiation into characteristics unique to each organism. In this article, we present an approach that we have developed to probe these early mineralization stages.
The most intricate and organized biomineral structures are formed under highly regulated biological environments. Based on these environments, biomineralization can be classified as an intracellular, intercellular, or extracellular process. Here, we will focus only on the extracellular process. The extracellular process occurs outside the cell wall on a matrix of organic macromolecules or proteins, known as the extracellular matrix (ECM), which controls numerous cell functions and also determines the rate of formation and the orientation of the inorganic crystals. Physiological extracellular mineralization in humans is restricted primarily to bones, teeth, and the hypertrophic zones of growth plate cartilage. In other organisms, examples include eggshells, nacre, and other shellfish structures (10–12). Pathological instances of ECM-mediated calcification are also common. For example, in humans calcification of vascular tissue is a common complication found in diseases like aging, atherosclerosis, and diabetes (1–3). Finding a remedy for these problems requires us to first obtain a fundamental understanding of the mineralization process at the molecular level.
Studies in this area have confirmed the ability of cells to alter the mineral formation process in vivo, in response to external factors (13–15). This control is accomplished through a feedback mechanism that allows the alteration of the composition of the ECM (14–16). Consequently, to mimic biomineralization, we first require a method that mimics the actual organization of the proteins in the ECM. In an attempt to achieve in vitro biomineralization, researchers have explored the use of simplified organic monolayers. Langmuir monolayers have been used to nucleate crystals and study their polymorphs (17). Self-assembled monolayers functionalized with moieties specific to certain proteins have been shown to control crystallization parameters such as crystallographic polymorphism, nucleation density, orientation, and localization (18–22). However, none of these surfaces imitate the highly organized fibrillar structure characteristic of the ECM. If tertiary protein structure is required to template true biomineralized structures, then it must be possible to experimentally demonstrate the difference between mineral nucleation of organized versus unstructured proteins under otherwise identical conditions.
Here, we present an approach for studying biomimetic mineralization that has two distinct advantages. First, we use self-assembled protein networks similar to the ECM, which provide a chemically tunable but biologically realistic mineralization substrate. Fibronectin protein, as we have recently shown (23), will spontaneously self-assemble on a charged polymer-coated silicon wafer. On high fixed-charge density surfaces, near −0.1 C/m2, a complex morphology is observed as fibrils begin to form. The intriguing aspect of this charge density is that it is approaching that measured on cell surfaces. Until we made this observation, that fibronectin will spontaneously undergo fibrillogenesis on high fixed-charge density surfaces, it was not understood why fibrils could form only on cell surfaces or lipid bilayer surfaces designed to mimic the plasma membrane. The amount of adsorbed protein and its morphology is controlled by the surface charges. In our study here, we use both elastin and fibronectin, which are major connective tissue components in most multicellular organisms. These proteins are incubated with the charged polymer, sulfonated polystyrene (SPS), coated over a silicon wafer (Fig. 1). The organized proteins provide the template for mineralization.
Fig. 1.
Schematic cross-section of the ECM fiber network self-assembled upon a thin protein layer on spin-coated SPS. Relative scales of AFM tip and fiber network are indicated.
The second advantage of our approach is the application of shear modulation force microscopy (SMFM), an atomic force microscopy (AFM)-based technique that measures the mechanical response of materials with 10-nm spatial resolution (24). The relative modulus of the protein fibers and the disorganized protein regions are monitored during the mineralization process. Hence mineralization can be probed at extremely early stages, well before any crystals can be detected by AFM topography imaging or other techniques. These methods give us the tools to measure the mechanical response of protein fibers after exposure to calcium carbonate for different times and compare the results to those obtained from unstructured protein and with negative control experiments carried out with calcium chloride.
Calcium carbonate is an abundant biomineral with a complicated phase diagram that includes hydrous and nonhydrous forms, each with several possible crystal structures (9). It is known that kinetics plays a role in crystal habit and polytype selection even when the CaCO3 phase is being modified by the presence of organics (25, 26). Therefore, it is important for the present study that we compare two mineralization methods with different kinetics. The first is a free drift method that uses a supersaturated calcium bicarbonate solution with initial [Ca2+] ≈9 mM, exposed to atmosphere (27). In the flow cell method, 2 mM of [Ca2+] solution is flowed from a reservoir through a small, closed precipitation chamber to maintain a constant thermodynamic driving force for mineralization (28). Late-stage mineralization was studied on dried samples by TOF–secondary ion mass spectroscopy (SIMS) to determine the Ca distribution on the surface, optical microscopy, and synchrotron x-ray diffraction.
Results and Discussion
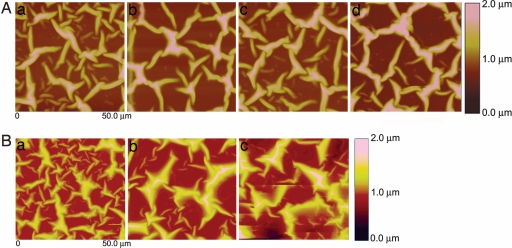
After 3 days of incubation in protein solution, a self-assembled network of the protein fibers was formed on the SPS surface as demonstrated by the AFM images in Fig. 2 Aa and Ba, with dimensions similar to that of the natural ECM. We know that elastin and fibronectin have a globular structure in solution and that their fibril formation requires unfolding of the protein domains. We postulate that the attraction between the charged polymer surface and the amphipathic protein allows the chains to unfold. Fibril formation then occurs because the proteins have specific domains for self-assembly as the chain concentration increases on the polymer surface (23). After immersing the samples in the 9-mM Ca(HCO3)2 solution (free drift method), the AFM images showed that the network structure was intact even after mineralizing the protein fibers for various periods of time (Fig. 2 A b–d and B b and c). Only the thickness of fibers increased, dependent on the reaction time with mineral solution.
Fig. 2.
AFM images (50 × 50 μm) showing network of proteins after exposure to CaCO3 mineralization conditions for different times. (A) Elastin at 0 min (a), 60 min (b), 90 min (c), and 120 min (d). (B) Fibronectin at 0 min (a), 60 min (b), and 120 min (c). (Magnifications: ×800.)
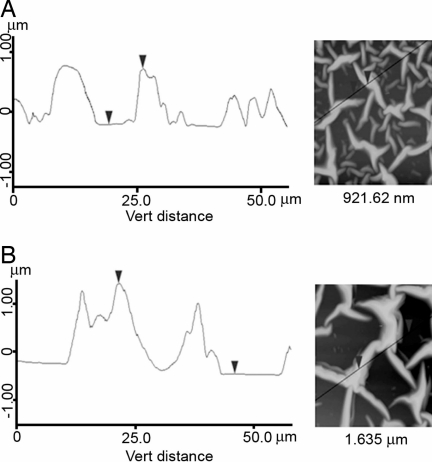
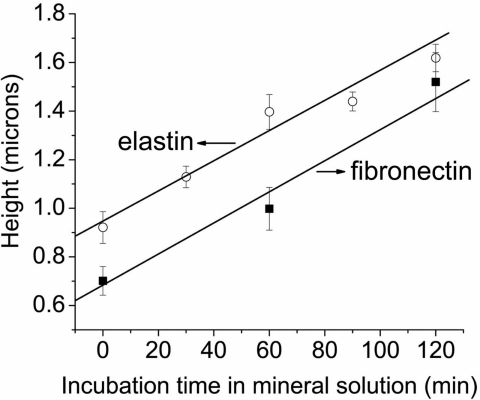
The heights were measured at different regions on the fibers with reference from flat regions, using the cross-sectional images (Fig. 3), averaging ≈20 measurements for each sample. The average height of the fibers was found to be 0.92 μm. However, after 2 h of immersion in mineral solution, the fiber heights increased by >70%, to 1.62 μm for elastin and 1.52 μm for fibronectin. Analysis of the samples for different times between 0 and 2 h revealed a monotonic increase in height (Fig. 4). More prolonged exposure to the mineral solution led to the formation of macroscopic crystals, confirming deposition of mineral on the surface.
Fig. 3.
Height profiles obtained by AFM along indicated lines of the elastin network after immersion in calcium bicarbonate solution for 0 min (A) and 120 min (B). (Magnifications: ×600.)
Fig. 4.
Average height of elastin and fibronectin fibers imaged by AFM as a function of immersion time with the free drift mineralization method.
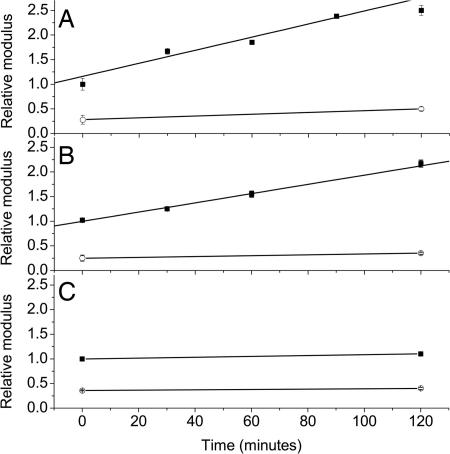
The physical consequence of this deposition was identified by using SMFM. This method uses an AFM tip to laterally modulate the surface and serves as a powerful tool to analyze the mechanical response from the surface (24). We know that before fiber formation the protein adsorbs first in a flat multilayer (23). Therefore, this experiment follows the mechanical properties not only on the organized protein fibers but also in the regions of unstructured protein between them (Fig. 1) and can distinguish between mineralization induced by simple chemical properties and that resulting from the tertiary structure. We observe that the modulus values on the fibers follow the same linear trend as the fiber heights (Fig. 5 A and B), increasing as a function of immersion time in the calcium bicarbonate solution. In contrast, the results obtained from the flat regions between the fibers (Fig. 5 A and B) showed no difference in modulus after 2 h, with their modulus being much smaller than that of the fibers. This finding indicated that hardening mainly occurred because of the interactions between the mineral and the proteins in the form of fibers. This selectivity may be attributed to the fact that the protein adsorbed in the thin layer has a different conformation from that self-assembled into fibers. Those domains of the fibrillar protein that are exposed apparently include the ones that are most conducive to mineralization. Our results also confirm that the modulus measurement made with SMFM is truly localized and sensitive for surface study. Otherwise the region in between the fibers would have appeared much stiffer, because of its proximity to the Si substrate.
Fig. 5.
Relative modulus of elastin (A) and fibronectin (B) fibers (■) and the flat regions (○) measured by using SMFM as a function of immersion time with the free drift mineralization method, and elastin fiber in CaCl2 solution (C).
SMFM measurements made on control samples immersed in 9 mM CaCl2 showed no significant change in the modulus either on or between the fibers (Fig. 5C). This result clearly differentiates a process of plain salt or cation adsorption from mineralization of the protein fibers by using mineral solution. Therefore, the increase in stiffness of protein fibers shows that mineralization is initiated from the time it starts to interact with the CaCO3 from the solution.
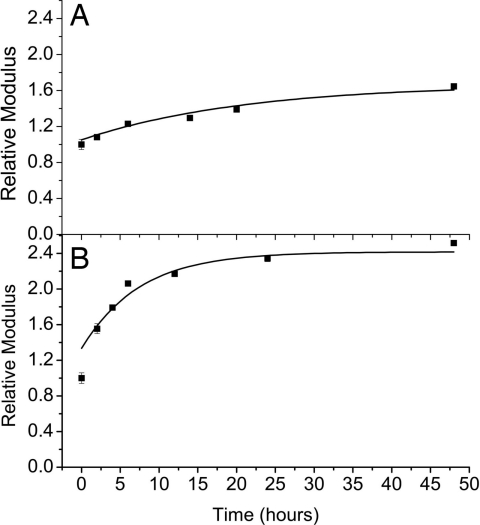
In a second series of experiments, the flow cell method was used to maintain a constant driving force during mineralization. SMFM measurements were carried out on the samples for selected mineralization times up to 48 h. The resulting height and modulus increase of the protein fibers was of the same order as that produced by the free drift method, but took a much longer immersion time (Fig. 6). The slow kinetics of mineralization in the flow cell was apparently determined by the low concentration (2 mM). Kinetics of mineral filling within the protein fibers thus seems to be dominated by the solution conditions in our system. Our results also show that mineralization can only affect the protein stiffness to a certain extent irrespective of the exposure time.
Fig. 6.
Relative modulus of elastin (A) and fibronectin (B) fibers measured by using SMFM as a function of immersion time with the flow cell mineralization method.
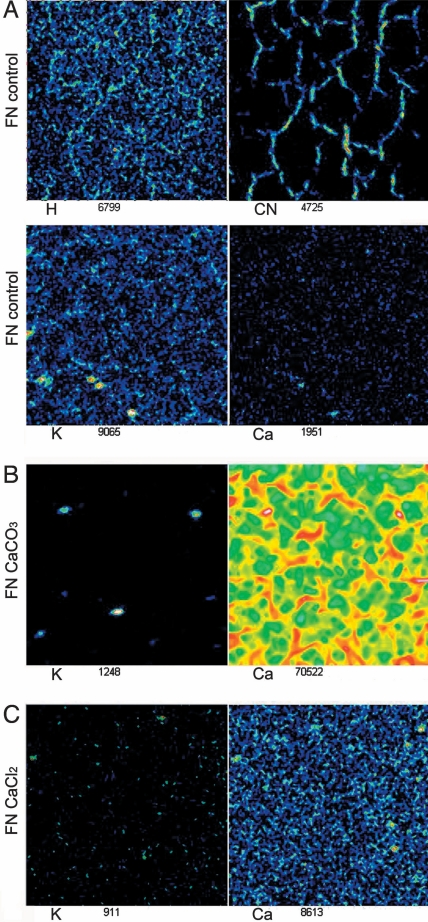
Chemical mapping of the fibronectin samples using TOF-SIMS was done both before and after calcification by the flow cell method, primarily to map the distribution of Ca on the surface. The maps of fibronectin samples before calcification (Fig. 7A) showed essentially no calcium, indicating its absence in the buffer, whereas K salt from the buffer was uniformly distributed on the surface. By contrast, CN from protein revealed the network morphology. After exposure to the calcium bicarbonate solution, Ca was preferentially concentrated and adsorbed on the protein fibers (Fig. 7B), whereas the K salt from the buffer was distributed with a less specific pattern. Reduced Ca in the unstructured regions between the fibers is a further confirmation that CaCO3 mineralization is preferentially induced on the fibers. As another control, fibronectin was immersed in 9 mM of CaCl2 solution for 24 h. Here the adsorption of Ca was not localized to specific regions; instead, Ca was more uniformly adsorbed on the surface. Therefore, Ca2+ cations alone cannot interact with protein fiber selectively.
Fig. 7.
TOF-SIMS chemical maps of fibronectin (A) and fibronectin mineralized by using the flow cell method for 48 h (B) and fibronectin immersed in CaCl2 sample for 24 h (C). Note that Ca is drastically enhanced on the fibers in the mineralized sample. (Magnifications: ×800.)
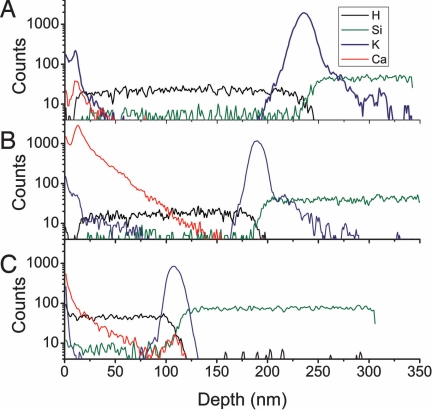
The localization of different species along the surface-normal direction in the films can also be determined from SIMS. Fig. 8 shows depth profiles obtained from a process of alternately scanning and ablating the samples by using SIMS, to a depth of ≈300 nm. In Fig. 8 the same fibronectin control, fibronectin mineralized by CaCO3 using the flow cell method, and fibronectin in CaCl2 samples are shown as in Fig. 7. The total depth of the organic film can be seen from the graphs of H, which extends uniformly to sample-dependent depths of 120–240 nm, and the graphs of Si, which begin to rise at the same points at which the H signals drop.
Fig. 8.
TOF-SIMS depth profile of fibronectin (A), fibronectin mineralized with flow cell method (B), and fibronectin immersed in a CaCl2 sample (C) for H, Si, K, and Ca. Depth has been calibrated by depth crater.
Salts such as K from the buffer show a surface signal of ≈100 counts, then drop in the protein film, and rise again to a peak near the Si interface. These data show that these cations were incorporated into the polymer layer during the protein incubation process. The above signals are essentially the same for all three samples. Ca, by contrast, distinguishes the three sample treatments. Ca is absent from the control, except for a low surface count rate attributable to contamination. The sample mineralized by CaCO3 has a large signal of 1,000–3,000 counts at the surface, with a significant peak at a depth of ≈20 nm (note the log scale used in Fig. 8). The Ca signal extends through the depth of protein, decreasing monotonically beyond the peak. The sample immersed in CaCl2 has a Ca signal significantly lower than that of the mineralized sample, showing that Ca was available from solution but not particularly concentrated in the proteins.
Optical microscopy enabled us to compare crystal sizes and distributions for the various methods. In the case of elastin and the free drift method, the largest crystals (>25 μm) were observed at the points where fibers cross each other, indicating favorable conditions for growth there compared with the other regions on the protein surface (Fig. 9 A and B). The major polymorph induced under these conditions is calcite (Fig. 9C). For fibronectin, the fiber crossings were not as significant for mineral growth. Particles formed in the flow cell were smaller (≤10 μm) and had morphologies and diffraction results indicating the mineral may be amorphous. This result suggests that although various ECM proteins may be conducive to mineral filling only the biomineral-associated proteins control growth at late stages, which may explain, for example, why fibronectin is implicated only in pathological biomineralization (as of arterial calcification) (30). Our next step is to use the ECM formed by living osteoblasts as the substrates for mineralization to take us closer to the goal of mimicking biomineralization.
Fig. 9.
Late mineralization data. (A and B) Optical micrographs showing crystal formation on elastin fibers after 24 h mineralization by the free drift method, indicating presence of crystals on the fiber vertices. (Magnifications: A, ×20; B, ×200.) (C) Synchrotron x-ray diffraction pattern from the same conditions (λ = 0.6525 Å).
Summary
Networks of self-assembled protein fibers, similar to the natural ECM found in vivo, were induced on negatively charged SPS surfaces and used as templates to induce biomimetic calcium carbonate mineralization. Mineral-induced thickening and stiffening of the protein fibers during early stages of mineralization were clearly demonstrated with AFM and SMFM. The calcium carbonate stiffened the protein fibers selectively without affecting the regions between them, emphasizing interactions between the mineral and the organized protein fibers. A significant effect of cation adsorption was ruled out by negative control experiments with CaCl2. Late-stage mineralization studies using optical microscopy revealed that crystals formed preferentially on the fibers, indicating favorable conditions for growth there. Ca distribution studied with SIMS clearly showed that Ca concentrated only on the fibers, which also seemed to concentrate Na salt from the buffer. We demonstrate that organized versus unstructured proteins can be assembled mere nanometers apart and probed in identical environments, where mineralization is proved to require the structural organization imposed by fibrillogenesis of the proteins.
Materials and Methods
Surface Preparation.
Polished 200-μm-thick Si(100) wafers were purchased from Wafer World (West Palm Beach, FL) and partitioned to 1 × 1-cm2 samples. The surfaces were treated with a modified Shiraki technique: the substrates were immersed in H2O/H2O2/NH4OH (4:1:1 vol) for 10 min at 80°C, rinsed in deionized water, and immersed in H2O/HF (3:1 vol) for 30 s at room temperature to create a hydrophobic surface. The surfaces were rinsed again in deionized water, immersed into H2O/H2O2/H2SO4 (3:1:1 vol) for 10 min at 80°C to form a hydrophilic surface, and finally kept in water before the polymer-coating procedure.
SPS (molecular mass ≈15 kDa) polymer with polydispersity Z < 1.1 was obtained from Polymer Source (Dorval, Canada). This polymer without further purification was dissolved in dimethylformamide (10 mg/ml). This solution was then spun cast onto the Si wafers (2,500 rpm × g; 30 s), to form a thin film (200 Å). The SPS-coated wafers were placed in a vacuum oven at 150°C for 24 h to remove the solvent and attach the polymer to the silicon wafer. The temperature was chosen to be higher than the glass transition, Tg ≈ 110°C, to allow the chains to relax, to form contacts with the surface, and to remove strains and excess solvent from the spinning process. The surfaces were checked to ensure that no dewetting occurred. Elastin from bovine neck ligament and fibronectin from bovine plasma were purchased from Sigma (St. Louis, MO). Physiologic PBS solution without calcium or magnesium (PBS: 140 mM NaCl/2.7 mM KCl/1.5 mM KHPO4/8.1 mM Na2HPO4·7H2O, pH 7.2) was obtained from Gibco/Life Technologies (Grand Island, NY). Prepared SPS substrates were immersed in 24-well dishes filled with 5 μg/ml of elastin and 100 μg/ml of fibronectin in PBS, respectively. The samples were incubated at 37°C at 100% humidity for 3 days.
Mineralization by Free Drift Method.
Supersaturated calcium bicarbonate solution was prepared as described (27). Calcium carbonate powder from Aldrich (St. Louis, MO) (≈2.5 g) was dissolved into 1 liter of deionized water by bubbling with CO2 gas for 24 h and stirring in a conical flask. The filtered solution of ≈9 mM [Ca2+] concentration was bubbled with CO2 gas for an additional hour to dissolve any remaining CaCO3 microparticles. Prepared protein film samples were rinsed in deionized water and then exposed to the calcium carbonate solution for 30–120 min or 24 h. Control samples were immersed in CaCl2 solution of 9 mM concentration for 120 min or 24 h.
Mineralization by Flow Cell Method.
This method was used to maintain a constant supersaturation and well defined driving force during the mineralization experiments (28). NaHCO3 (2.0 mM) and 2.2 mM of CaCl2 solution were mixed and bubbled with a premixed gas of N2 and CO2 with pCO2 = 10−3.5 for 12 h before the experiments and throughout the mineralization procedure. NaCl was used to fix the ionic strength at 0.08 M. The pH and calculated driving force of the resulting solution are 8.57 and 1.92, respectively. This condition was selected to avoid a spontaneous precipitation of calcium carbonate. Samples were placed in a rectangular polychloro-trifluoroethylene cell and flowed with the mineral solution in a closed system by using a peristaltic pump. Flow cell mineralization of protein film samples was carried out for different periods from 0 to 48 h.
AFM and SMFM.
Characterization of the samples incubated in the protein and salt solutions was carried out with an atomic force microscope (Digital Instruments, Buffalo, NY) in the contact mode in PBS solution at room temperature. Silicon nitride (Si3N4) tips from thermal microscopes (spring constant 0.032 N/m) were used for the measurements. Apart from imaging, the mechanical response (modulus) of the samples was measured by using the SMFM. To make these measurements, the piezo scanner in the AFM was made to perform slow and fast scans in perpendicular directions on the sample creating oscillations of the tip on the surface at a sinusoidal frequency of 1,400 Hz. A constant normal force of 25 nN was used to maintain contact of the tip with the surface.
The amplitude response of the tip is a function of the normal force and the physical properties of the sample in which the tip is partially buried. By approximating the system as three coupled springs, it can be shown that the ratio of the response amplitude to the driving force is proportional to E−2/3, where E is the Young's modulus (24, 29). By measuring a series of response curves on the sample over the linear range of force applied, a relative measure of the modulus is obtained that can be compared over different sample regions at chosen times during the mineralization process.
Three different sets of readings were taken at different regions with three measurements for each set. In particular we want to note that the protein, after forming a thin layer on the SPS, forms fibers that are higher than 1 μm in scale with flat regions between them. The AFM tip size and indentation during SMFM measurements are of order 2–3 nm, making it possible to unambiguously probe the modulus of the fibers relative to the flat regions between them.
SIMS.
Static and dynamic imaging SIMS experiments were conducted by using an ion TOF-IV instrument equipped with a liquid metal analyzing gun and a dual sputtering gun. The 25-keV, 1-pA 69Ga+ ion beam with a 45° incidence angle was used to obtain 256 × 256-pixel images of a 50 × 50-μm2 area with a resolution >0.5 μm. Negative ion dynamic imaging had been done by using the 133Cs+ 3-keV, 25-nA beam with an incident angle of 45° to sputter a 150 × 150-μm2 area of the samples. Positive ion dynamic imaging had been done by using the Ar+ 3-keV, 20-nA beam with an incident angle of 45° to sputter a 150 × 150-μm2 area of the samples. Noninterlaced mode with a cycle time of 100 ms was used in both cases. A pulsed low-energy electron flood gun (20 eV, 5 μA) was used to compensate for the charging of the polymer samples. The surface of the samples has been sputtered to the depth of ≈20 nm, and images have been obtained starting from that depth. A total of 25–50 scans for each secondary ion in the range of 1 to 100 m/z were combined in one image to enhance contrast. The secondary ion intensity color scale was adjusted separately for each image to give better visualization and does not indicate absolute secondary ion intensity. Characteristic masses of organics, K and Ca ions, were detected. All late-stage characterization was carried out on dry samples after mineralization or immersion in the CaCl2 solution for control without washing with deionized water.
Optical Microscopy and X-Ray Diffraction.
Late-stage mineralization was studied by using optical microscopy to observe the formation and distribution of crystals on the surface. X-ray diffraction experiments were carried out on beamline X6B at the National Synchrotron Light Source at Brookhaven National Laboratory. Protein films mineralized by the free drift method were investigated by using a focused x-ray beam at 0.6525-Å wavelength and with 0.2 × 0.2-mm2 spot size. Samples were measured in air in reflection geometry at a grazing incident angle of 0.5°, which spreads the illuminated area into a stripe 0.2 mm wide running the length of the sample (≈10 mm).
Acknowledgments
Brookhaven National Laboratory is supported by U.S. Department of Energy Contract DE-AC02-98CH10886. This work was supported by the National Science Foundation Materials Research Science and Engineering Centers and the Brookhaven National Laboratory–Stony Brook University Seed Grant Program.
Abbreviations
- ECM
extracellular matrix
- SPS
sulfonated polystyrene
- SMFM
shear modulation force microscopy
- AFM
atomic force microscopy
- SIMS
secondary ion mass spectroscopy
Footnotes
The authors declare no conflict of interest.
This paper was submitted directly (Track II) to the PNAS office. L.A. is a guest editor invited by the Editorial Board.
References
- 1.Schinke T, McKee MD, Karsenty G. Nat Genet. 1999;21:150–151. doi: 10.1038/5928. [DOI] [PubMed] [Google Scholar]
- 2.Hunter GK, Goldberg HA. Proc Natl Acad Sci USA. 1993;90:8562–8565. doi: 10.1073/pnas.90.18.8562. [DOI] [PMC free article] [PubMed] [Google Scholar]
- 3.Murshed M, Shinke T, McKee MD, Karsenty G. J Cell Biol. 2004;165:625–630. doi: 10.1083/jcb.200402046. [DOI] [PMC free article] [PubMed] [Google Scholar]
- 4.Singla A, Lee CH. J Biomed Mater Res. 2002;60:368–374. doi: 10.1002/jbm.10077. [DOI] [PubMed] [Google Scholar]
- 5.Service RF. Science. 1999;286:2442–2444. [Google Scholar]
- 6.Belcher AM, Wu XH, Christensen RJ, Hansma PK, Stucky GD, Morse DE. Nature. 1996;381:56–58. [Google Scholar]
- 7.Mann S, Webb J, Williams RJP, editors. Biomineralization: Chemical and Biochemical Perspectives. New York: VCH; 1989. [Google Scholar]
- 8.Dove PM, De Yoreo JJ, Weiner S. In: Biomineralization: Reviews in Mineralogy and Geochemistry. Russo JJ, editor. Washington, DC: Mineralogical Society of America Geochemical Society; 2003. pp. 1–29. [Google Scholar]
- 9.Lowenstam HA, Weiner S. On Biomineralization. New York: Oxford Univ Press; 1989. [Google Scholar]
- 10.Nys Y, Hincke MT, Arias JL, Garcia-Ruiz JM, Solomon SE. Poultry Avian Biol Rev. 1999;10:143–166. [Google Scholar]
- 11.Nys Y, Gautron J, McKee MD, Garcia-Ruiz JM, Hincke MT. World's Poultry Sci J. 2001;57:401–413. [Google Scholar]
- 12.Parsons AH. Poultry Sci. 1982;61:2013–2021. [Google Scholar]
- 13.Simkiss K, Wilbur KM. Biomineralization: Cell Biology and Mineral Deposition. New York: Academic; 1989. [Google Scholar]
- 14.Smith BL, Schäffer TE, Viani M, Thompson JB, Frederick NA, Kindt J, Belcher J, Stucky GD, Morse DE, Hansma PK. Nature. 1999;399:761–763. [Google Scholar]
- 15.Michenfelder M, Fu G, Lawrence C, Weaver JC, Wustman BA, Taranto L, Evans JS, Morse DE. Biopolymers. 2003;70:522–533. doi: 10.1002/bip.10536. [DOI] [PubMed] [Google Scholar]
- 16.Weiner S, Addadi L. J Mater Chem. 1997;7:689–702. [Google Scholar]
- 17.Litvin AL, Valiyaveetil S, Kaplan DL, Mann S. Adv Mater. 1997;9:124–127. [Google Scholar]
- 18.Küther J, Tremel W. Thin Sold Films 327–. 1998;329:554–558. [Google Scholar]
- 19.Theobald JA, Oxtoby NS, Philips MA, Champness NR, Beton PH. Nature. 2003;424:1029–1031. doi: 10.1038/nature01915. [DOI] [PubMed] [Google Scholar]
- 20.Shen Q, Chen Y, Wei H, Zhao Y, Wang D, Xu D. Crystallogr Growth Des. 2005;5:1387–1391. [Google Scholar]
- 21.Kwak SY, DiMasi E, Han YJ, Aizenberg J, Kuzmenko I. Crystallogr Growth Des. 2005;5:2139–2145. [Google Scholar]
- 22.Aizenberg J. Adv Mater. 2004;16:1295–1302. [Google Scholar]
- 23.Pernodet N, Rafailovich M, Sokolov J, Xu D, Yang NL, McLeod K. J Biomed Mater Res. 2003;64:684–692. doi: 10.1002/jbm.a.10394. [DOI] [PubMed] [Google Scholar]
- 24.Zhang Y, Ge S, Rafailovich MH, Sokolov JC, Colby RH. Polymer. 2003;44:3327–3332. [Google Scholar]
- 25.Mann S, Heywood BR, Rajam S, Birchall JD. Proc R Soc London Ser A. 1989;423:457–471. [Google Scholar]
- 26.DiMasi E, Olszta MJ, Patel VM, Gower LB. Crystallogr Eng Commun. 2003;5:346–350. [Google Scholar]
- 27.Kitano Y. Bull Chem Soc Jpn. 1962;35:1972–1985. [Google Scholar]
- 28.Travaille AM. Thesis. Nijmegen, The Netherlands: Radbond University; 2004. [Google Scholar]
- 29.Ge S, Pu Y, Zhang W, Rafailovich M, Sokolov J, Buenviaje C, Buckmaster R, Overney RM. Phys Rev Lett. 2000;85:2340–2343. doi: 10.1103/PhysRevLett.85.2340. [DOI] [PubMed] [Google Scholar]
- 30.Watson KE, Parhami F, Shin V, Demer LL. Arterioscler Thromb Vasc Biol. 1998;18:1964–1971. doi: 10.1161/01.atv.18.12.1964. [DOI] [PubMed] [Google Scholar]


