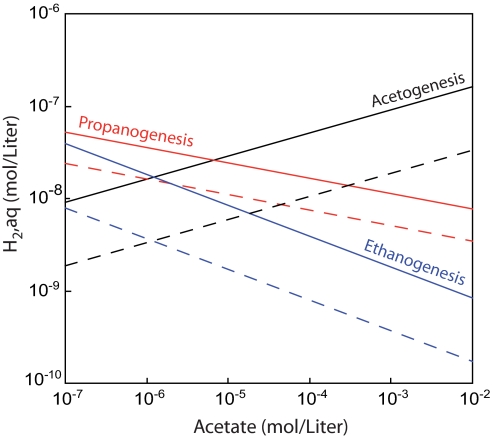
Fig. 4.
Conditions yielding ΔG = −15 kJ (thick, solid lines) and ΔG = 0 kJ (dotted lines) for ethanogenesis (reaction 1, blue), propanogenesis (reaction 2, red), and homoacetogenesis (black) as a function of concentrations of acetate and hydrogen, assuming conditions considered typical for marine sediments (e.g., ref. 1): T = 10°C, [DIC] = (10 mM), pH = 8, [ethane]aq = 20 nM, [propane]aq = 20 nM, P = 200 bar. The horizontal axis depicts the range of acetate concentrations observed in marine sediments.

