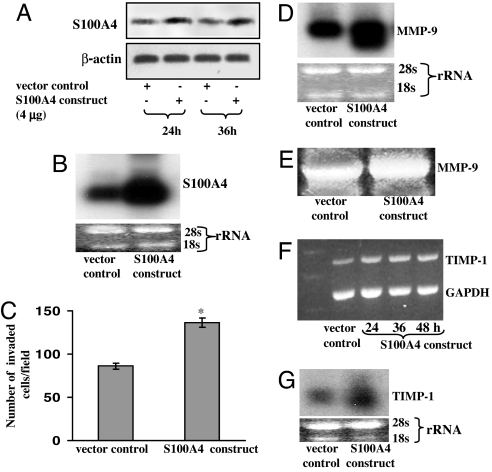
Fig. 3.
Effect of S100A4 overexpression by transfection of S100A4-pcDNA3.1 plasmid on MMP-9, its tissue inhibitor, and on the invasive capability of PC-3 cells. (A and B) Representative images showing expression of S100A4 in vector (pcDNA3.1) and pcDNA3.1-S100A4 transfected cells as analyzed by Western (A) and Northern (B) blot analysis. (C) Histogram showing invasive capability of transfected cells. Each bar represents mean ± SE (n = 3); ∗, P < 0.05. (D) Autoradiographic images showing the expression of MMP-9 mRNA in transfected cells as determined by Northern blot analysis. (E) Representative image showing gelatinolytic activity of MMP-9 in transfected cells. (F and G) Representative images showing expression of TIMP-1 in transfected cells as determined by RT-PCR (F) and Northern blot (G) analysis. Equal loading of protein was confirmed by stripping the blots and reprobing with anti-β-actin antibody. Equal loading of PCR products and RNA was confirmed by using constitutively expressed GAPDH and by measuring the 28S rRNA, respectively. Densitometric measurements of the band in RT-PCR and Northern blot analysis were performed by using the digitizing scientific software UN-SCAN-IT. All experiments were repeated three times with similar results.

