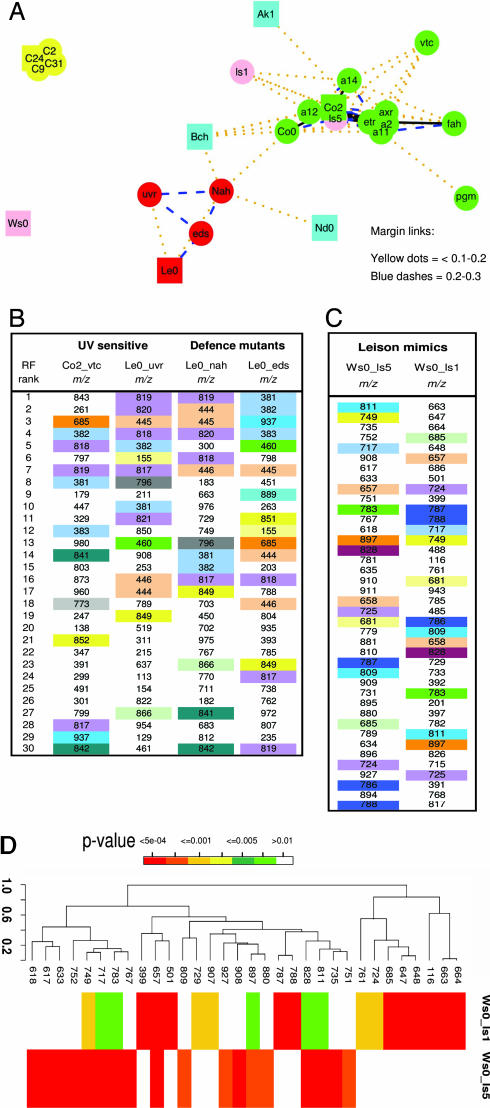
Fig. 3.
Metabolome modeling with larger multiple class problems. (A) Two-dimensional mapping of 25 Arabidopsis lines using Sammon nonlinear mapping. Control ecotypes are colored blue, and progenitor ecotypes of mutant lines are presented as squares. The ecotype background of mutant lines is depicted by color: red, LeO; yellow, C24; pink, Ws0; green, Columbia. The lines linking phenotypically related genotypes represent margins in pair-wise comparisons and are color coded as follows: black solid line, <0.1; yellow dotted line, 0.1–0.2; blue dashed line, 0.2–0.3. Margins >0.3 have been omitted for the representation. (B) Top ranking signals in common (color coded) between RF models representing pair-wise comparisons between selected defense related and UV sensitive genotypes and their progenitor ecotypes. (C) RF models comparing lesion mimic mutants (ls1 and ls5) with the progenitor genotype (Ws0) indicating the presence of many common signals (color coded). (D) A correlation analysis of variables contributing significantly (P = < 0.005) to models discriminating mutant lines ls1 and ls5 from the progenitor ecotype Ws0.

