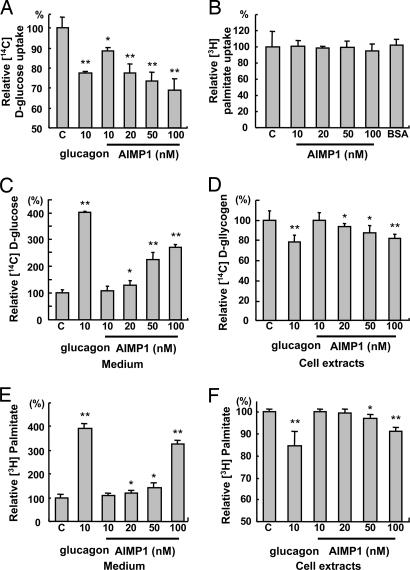
Fig. 4.
The effect of AIMP1 on glucose uptake, glycogenolysis, and lipolysis. We treated HepG2 with the indicated concentrations of AIMP1 and assayed the uptake rate of [U-14C]d-glucose (A) and [3H]palmitate (B). Glucagon was used as a positive control. We stimulated glycogen synthesis in HepG2 with 10 nM insulin, 25 mM d-glucose, and 2 μCi/ml [U-14C]d-glucose for 16 h, and we induced glycogenolysis by incubating cells with glucose-free DMEM containing glucagon or AIMP1 for 4 h. The culture medium (C) and cells (D) were harvested to quantify [U-14C]d-glucose. We cultured and differentiated 3T3-L1 into adipocytes as described in Materials and Methods. We induced the uptake of [3H]palmitate (1 μCi/ml) for 2 h and treated the cells with glucagon or AIMP1 for 7 h. The culture medium (E) and adipocytes (F) were harvested to measure [3H]palmitate as described in Materials and Methods. The values are means ± SD. ∗, P < 0.06; ∗∗, P < 0.01.

