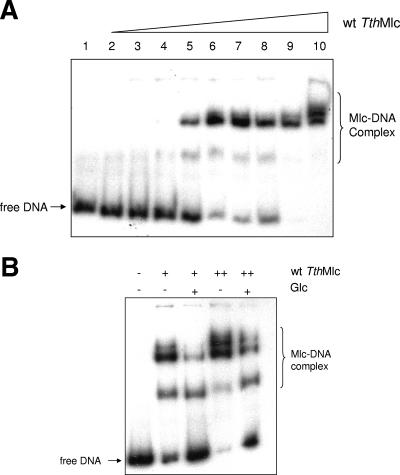
FIG. 5.
EMSA between MlcTth and the T. thermophilus mlc promoter. (A) Lanes 1 to 10 represent reactions using 8 ng of labeled DNA amplified from the promoter region of mlc (TTC0329) with the following concentrations of wild-type MlcTth: 0, 0.21, 0.28, 0.56, 0.67, 0.84, 1.11, 1.26, 1.67, and 3.32 μM. (B) Each reaction was done with the same quantity of labeled DNA (8 ng). + and ++, 1.11 and 1.67 μM Mlc, respectively. Glucose was added to a concentration of 200 μM.

