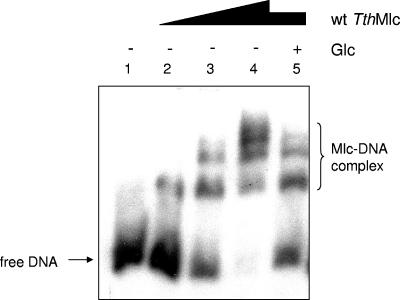
FIG. 8.
EMSA between MlcTth and the malE1 promoter region. Lanes 1 to 5 represent reaction mixtures with 12 ng of labeled DNA amplified from the promoter region of malE1 and increasing concentrations of wild-type MlcTth. Lanes 1 to 4, 0, 0.84, 1.67, and 3.32 μM, respectively. Lane 5 contained 1.67 μM MlcTth (identical to lane 3) but was done in the presence of 200 μM glucose.

