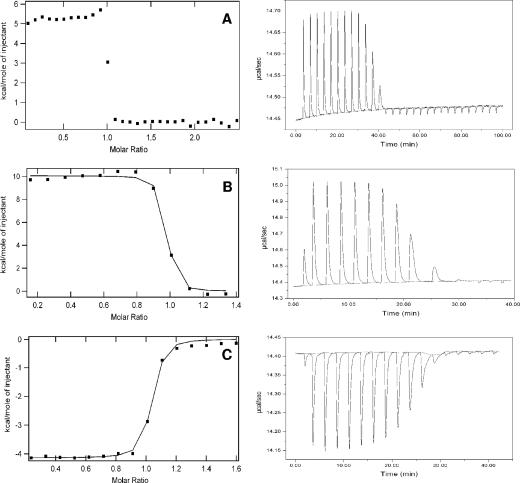
FIG. 3.
(A and B) ITC of 10 μM WtpA titrated with injections of 0.8 μM tungstate (A) and 1 μM molybdate (B). (C) Displacement titration of 10 μM WtpA incubated with 15 μM molybdate, with injections of 1 μM tungstate. Data were fitted (continuous line in panels B and C) with ORIGIN software. The raw ITC data are shown in the right graphs.

