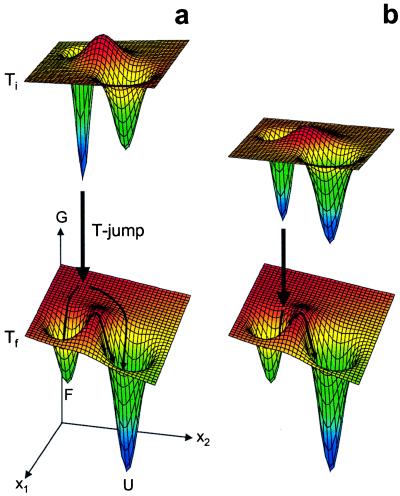
Figure 3.
Schematic representations of the free energy surfaces at the Ti (Upper) and Tf (Lower) of a typical T jump experiment. x1 and x2 represent generalized unfolding reaction coordinates as described in the text. The symbols F and U represent the folded and unfolded states, respectively. The downwards arrow symbolizes the T jump, and the arrows on the final surface represent the possible pathways immediately after the T jump. (a) Scenario for a large T jump. (b) Scenario for a small T jump.

