Figure 1.
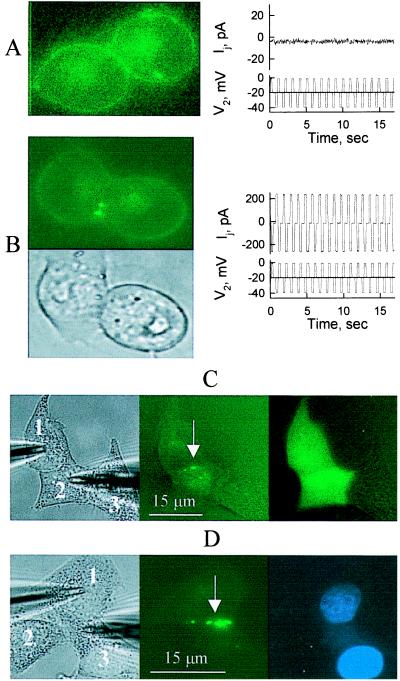
Cx43–EGFP fluorescence forms junctional plaques correlated with electrical coupling and dye transfer. (A) N2A cell pair showing only diffuse Cx43–EGFP fluorescence staining in appositional and other membrane areas (Left) was not electrically coupled (Right). Voltage steps applied to one cell (transjunctional voltage, Vj, Lower trace) produced no changes in junctional current (Ij) recorded in the unstepped cell. (B) A cell pair showing two junctional plaques and diffuse membrane staining elsewhere (Left, fluorescent and phase-contrast images) was electrically coupled as indicated by the large changes in Ij in response to an applied Vj. Coupling conductance was ≈12 nS. (C and D) Electrically coupled HeLa cells containing Cx43–EGFP plaques show Lucifer Yellow and DAPI cell–cell transfer. (Left) Phase. (Center) Fluorescence before dye injection. (Right) After dye injection. (C) A cluster of three cells. Lucifer Yellow was injected into cell 2 and transferred to cell 1 but not cell 3. A large (arrow) and a small plaque could be seen between cells 1 and 2; gj = 15 nS. No plaques were evident between cells 2 and 3. The fluorescent image (taken 5 min after dye loading of cell 2) showed spread to cell 1 but not cell 2. (D) A cluster of three cells. DAPI was injected into cell 2 and transferred to cell 1 but not cell 3. Four junctional plaques could be seen between cell 1 and cell 3; gj = 40 nS; however, no plaques were seen with cell 2. The fluorescent image taken 14 min after dye loading of cell 3 showed labeling of the nuclei of cells 1 and 3 but not cell 2.

