Figure 3.
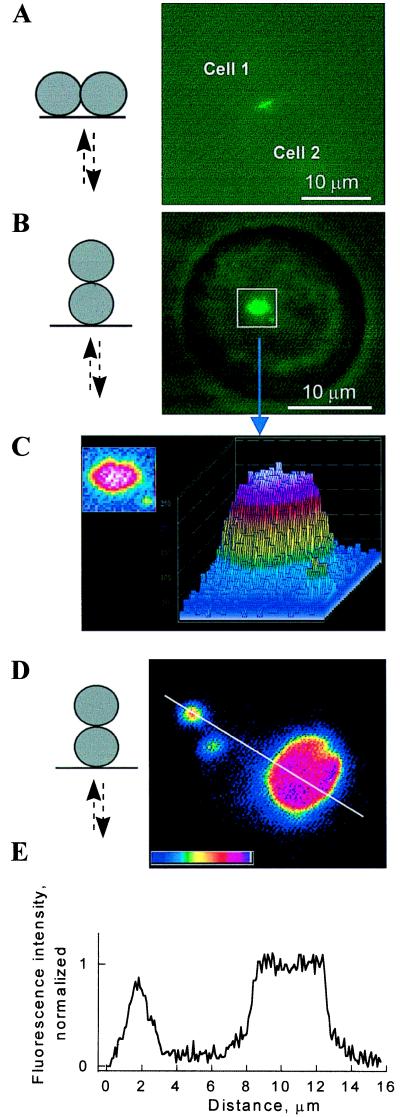
Fluorescence intensity reaches a plateau in the center of en face images of larger Cx43–EGFP plaques. Schematic drawings (Left) show orientations of the cell pairs and light paths for excitation (upward arrows) and emission (downward arrows). (A and B) Side-by-side and en face views of a Cx43–EGFP plaque in an N2A cell pair. (C) Two- and three-dimensional pseudocolor plots of fluorescence intensity in the square shown in B show a plateau in the central region of the plaque. (D) En face views of large and small plaques in a HeLa cell pair. (E) Plot of fluorescence intensity along the line shown in D crossing two of the three plaques. Fluorescence intensity is normalized to the average plateau value in the center of the largest plaque. Peak fluorescence was smaller in small plaques, but fall-off at edges was about the same. Pseudocolor in C and D was adjusted to maximize the range of fluorescence intensity.

