Figure 2.
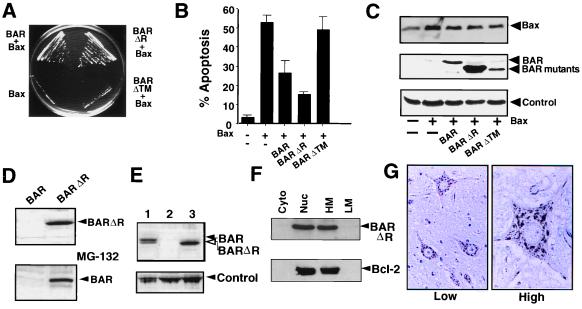
BAR inhibits Bax-induced cell death in yeast and mammalian cells. (A) Plasmids encoding BAR, BAR(ΔR), BAR(ΔTM), or control plasmid were transformed into a yeast strain harboring YEp51-Bax. Transformants were streaked on galactose-containing synthetic medium lacking tryptophan and leucine and photographed after 4 days at 30°C. (B) 293T cells were transiently cotransfected with 0.1 μg of GFP-encoding marker plasmid and 4 μg of either pcDNA3 control (−) or 0.5 μg pcDNA3-Bax (+) plasmids together with 3.5 μg of plasmids encoding BAR, BAR(ΔR), or BAR(ΔTM) or a control plasmid (−). After 1 day, both floating and adherent cells (after trypsinization) were pooled, fixed, and stained with DAPI (18). The percentage of GFP-positive cells with fragmented nuclei or condensed chromatin (apoptotic) was determined (mean ± SD; n = 3). (C) 293T cell extracts (25 μg total protein) were prepared from the transfected cells shown in B and subjected to SDS/PAGE immunoblot analysis. (D) 293T cells were transfected with 2 μg of BAR- or BAR(ΔR)-encoding plasmids (Upper). Cell extracts (25 μg total protein) were prepared 1 day later and subjected to SDS/PAGE immunoblot analysis, by using anti-BAR antiserum. For determination of the effects of proteosome inhibition on BAR protein accumulation, 293T cells transfected with BAR-producing plasmid as above were cultured for 6 hr with (+) or without (−) 20 μM MG-132 before lysis and immunoblot analysis as above (Lower). Exposure times to x-ray film were adjusted to maximize differences. Longer exposures, however, demonstrated the presence of both full-length BAR and BAR(ΔR). (E) Immunoblot comparison of BAR levels in lysates (25 μg protein) prepared from MCF7 (1), control-transfected 293T cells (2), and BAR(ΔR)-transfected 293T cells (3), probed with anti-BAR antiserum. A band from the same blot resulting from anti-rabbit secondary antibody reactivity with an unidentified human protein is shown as a control for loading. (F) 293T cells were transiently transfected with plasmids encoding BAR(ΔR) and Bcl-2, then lysed 2 days later, and crude subcellular fractions of cytosol (Cyto), nuclei (Nuc), heavy membranes (HM), and light membranes (LM) were prepared (20). Fractions were normalized for cell equivalents and analyzed by SDS/PAGE immunoblotting, by using antisera specific for BAR (Upper) and Bcl-2 (Lower). (G) Immunohistochemistry-based analysis of BAR was performed by using paraffin-embedded tissue sections from multiple human tissues (spinal cord is shown here) and anti-BAR antiserum with DAB-colorimetric detection. Representative photomicrographs show neurons at lower (Left) and higher (Right) magnification, demonstrating punctate organelle-like distribution of BAR.

