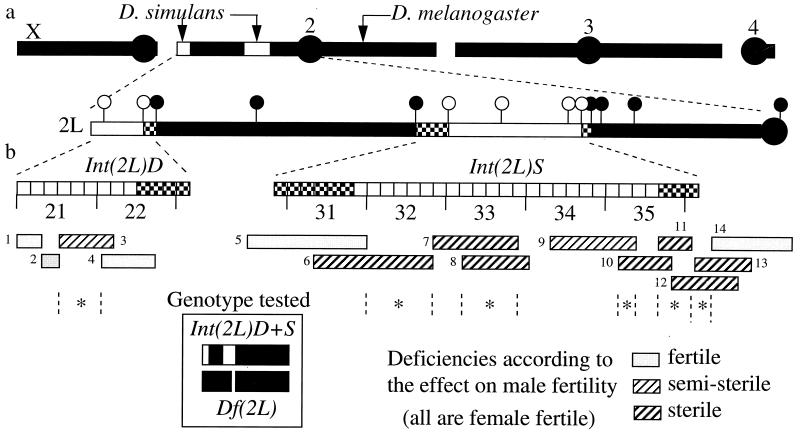
Figure 3.
(a) Mapping of D. simulans introgressions, Int(2L)D+S, by molecular markers. Dark and light bars denote D. melanogaster and D. simulans chromatids, respectively. Checkered bars denote regions of uncertain species origin. The markers used [and their cytological locations (18)] are, from Left to Right: [ex (21C3–4), aop (22D1–2)], Pgk (23A1–2), Acp26Aa (26A1–5), bib (30F1–6), [da (31E1–7), prd (33C1), Adh (35B2), CycE (35D7)], grp (36A10–14), dl (36C2), Ddc (37C1), Rsp (h39), where [ ] corresponds to the boundaries of introgressions. (b) Mapping genes of reproductive isolation by deficiencies. Each deficiency is tested over Int(2L)D+S as shown in Inset, where blank regions indicate introgressions, and the gap denotes a deletion. The numbers below the chromosome indicate the cytological intervals; further divisions of each interval into six letter regions (A–F) are also given. Fourteen deficiencies were used, and the fertility of the tested genotype is indicated. Loci of hybrid male sterility are indicated by stars; no female sterility is observed over any of these deficiencies. Deficiencies no. 10 and no. 11 result in inviability over the introgressions in the one subline that is homozygote inviable.

