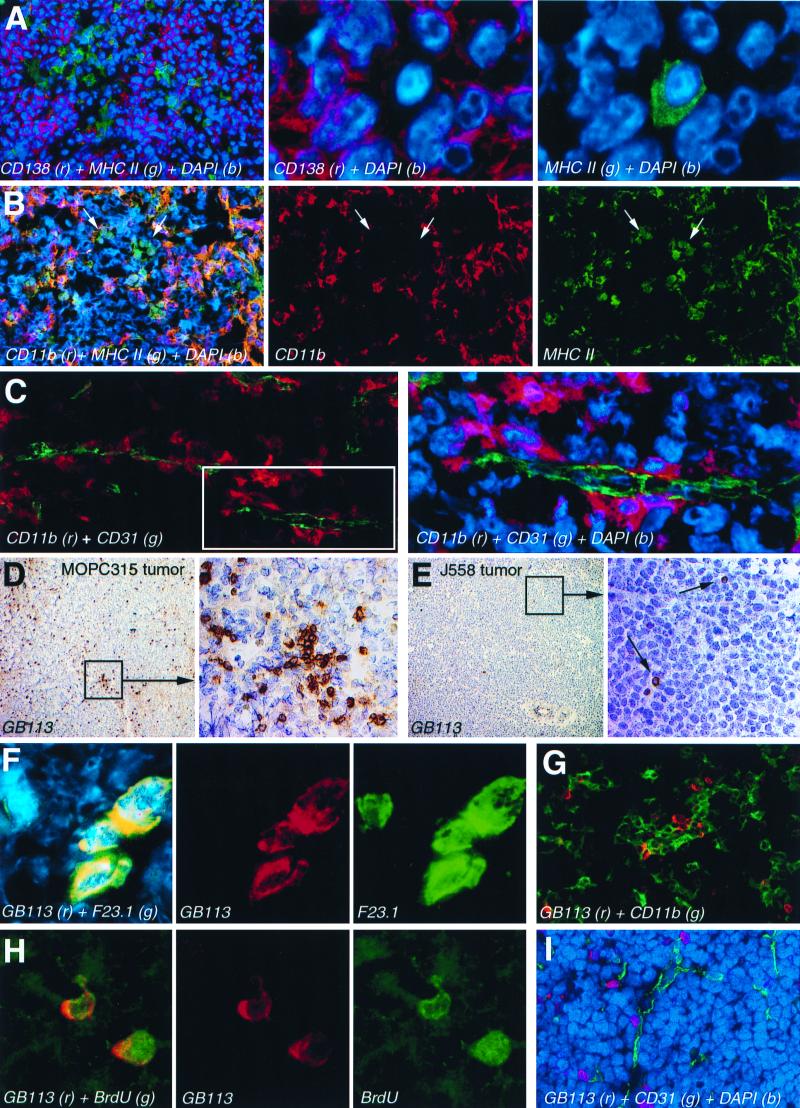
Figure 3.
Immunohistochemical characterization of APC and T cells in small MOPC315 tumors. (A) Staining with anti-CD138 (Syndecan-1) and anti-class II (I-Ed) and DAPI (nuclei). (B) Staining with anti-CD11b (Mac-1) and anti-class II. Arrows indicate clusters of cells that are class II+ CD11b−. (C) (Left) Staining with anti-CD31 (green) and anti-CD11b (red). (Right) Two-fold magnification of the framed field on the left with DAPI-stained nuclei. (D and E) (Left) Single staining with TCR-TG- clonotype specific GB113 mAb (brown) of small Id+ MOPC315 (D) or Id− J558 (E) tumors, with hematoxilin-stained nuclei. (Right) Five-fold magnifications of framed fields on the left. (F) Staining with GB113 and Vβ8-specific F23.1 mAbs, and DAPI. (G) Staining with GB113 and anti-CD11b mAbs. (H) Staining of tumor sections, from mice given BrdUrd, with GB113 and anti-BrdUrd mAbs. (I) Staining with GB113 mAb (red), anti-CD31 mAb (green), and DAPI.

