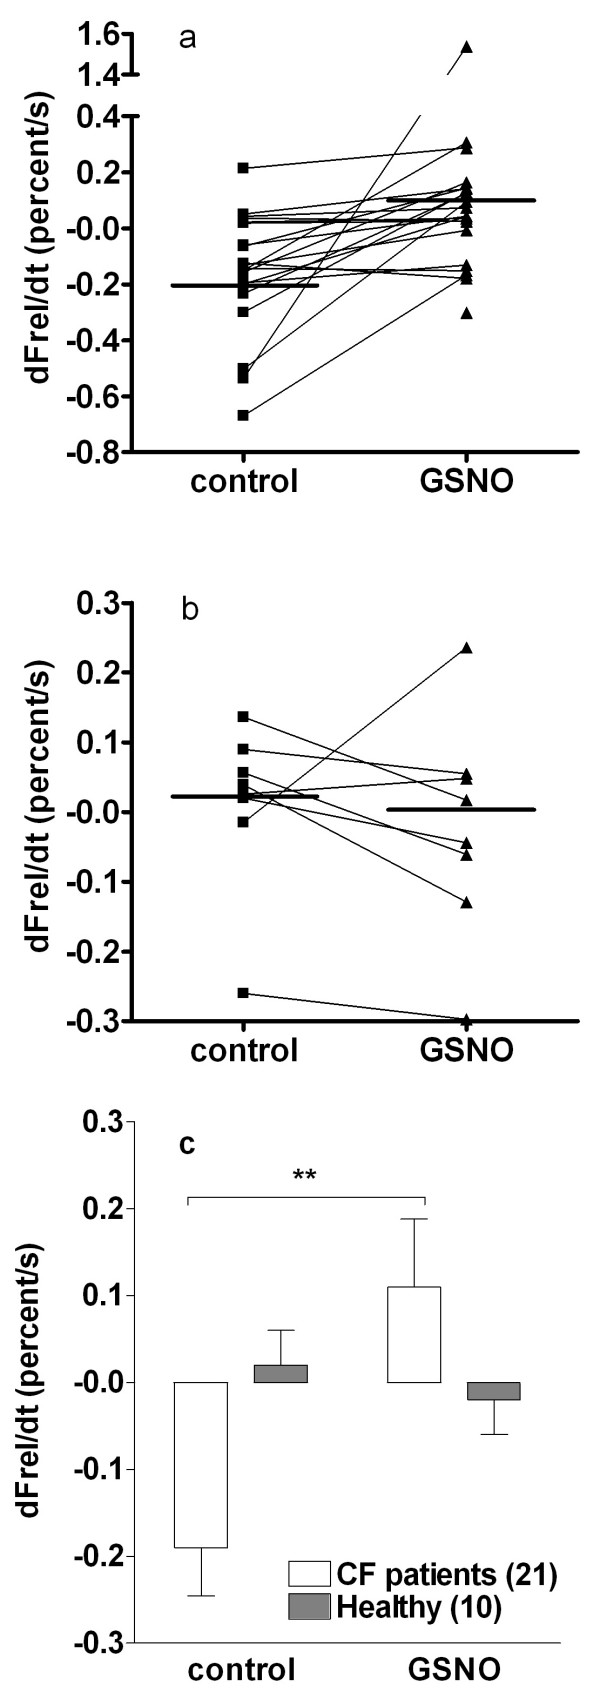
Figure 1.
The effect of GSNO treatment (60 μM for 4 hours) on the Cl- relative efflux rate measured in nasal epithelial cells with the MQAE fluorescence method. Individual data from (a) CF patients and (b) healthy subjects; horizontal line indicates the mean. (c) Data are expressed as mean ± SEM and the number of subjects in each group is shown in the parentheses beside the legend. Significant difference from the control (paired Student's t-test) is indicated by asterisks (** p < 0.01).

