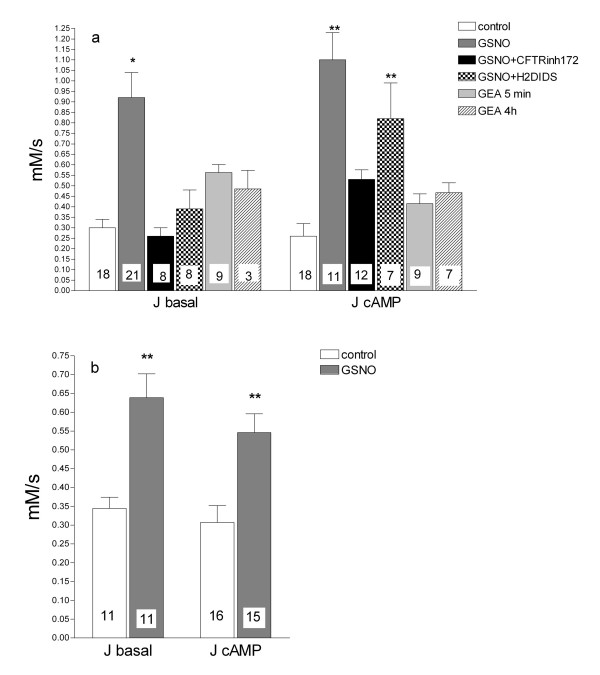
Figure 3.
The effect of GSNO and GEA in CFBE (A) and CFSME (B) cells on the Cl-efflux rate. Cells were treated with 60 μM GSNO for 4 hours or 25 μM GEA for the indicated time, then the Cl- efflux rate was measured with the fluorescent indicator MQAE. "J basal": the basal efflux rate (recorded during exposure to Cl--free SR without agonists). "J cAMP": the cAMP-stimulated efflux rate (recorded during exposure to Cl--free SR containing 20 μM forskolin and 100 μM IBMX). For some experiments, during the basal efflux 400 μM DIDS was used to block Cl- channels (different from CFTR), while the CFTR specific inhibitor CFTRinh-172 (40 μM) was used during the cAMP-stimulated efflux. Data are expressed as mean ± SEM and the number of experiments in each group is shown in each column. Significant difference from the control (ANOVA) is indicated by asterisks (* p < 0.05, ** p < 0.01).

