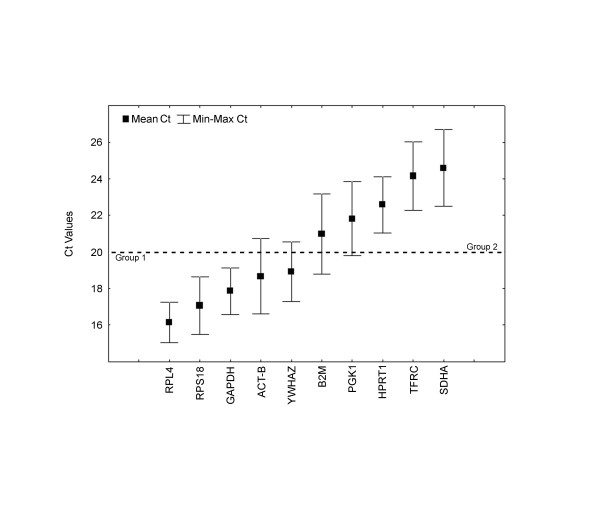
Figure 1.
Expression levels of candidate HKGs. Expression levels of candidate control genes in the tested striped dolphin skin biopsies (n = 30). Values are given as qRT-PCR cycle threshold numbers (Ct values). Boxes represent mean Ct values and whiskers the range of Ct values in the 30 samples. The arbitrary line at Ct 20 distinguishes two groups of similarly expressed housekeeping genes.

