
Figure 2.
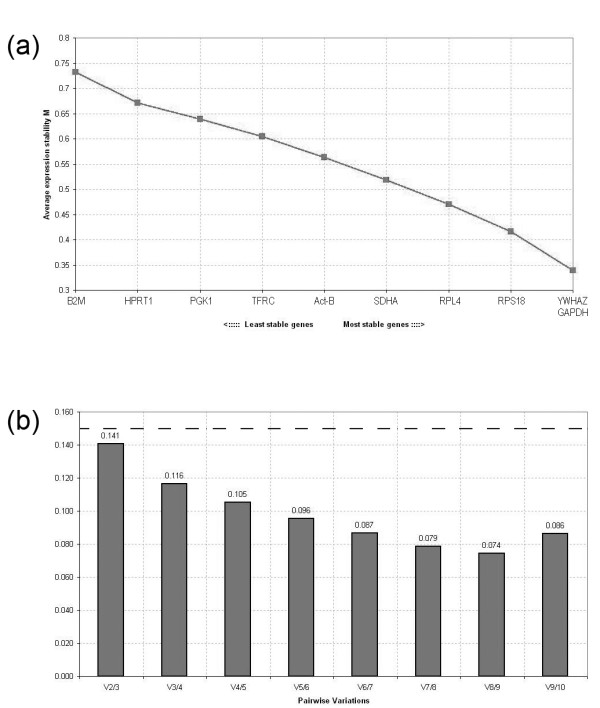
geNorm output charts. (a) average expression stability measure (M) of control genes during stepwise exclusion of the least stable control genes; (b) determination of the optimal number of control genes for normalization calculated on the basis of the pair-wise variation (V) analysis; V values under 0.15 threshold line indicate no need to include further HKG for calculation of a reliable normalization factor.