
Figure 3.
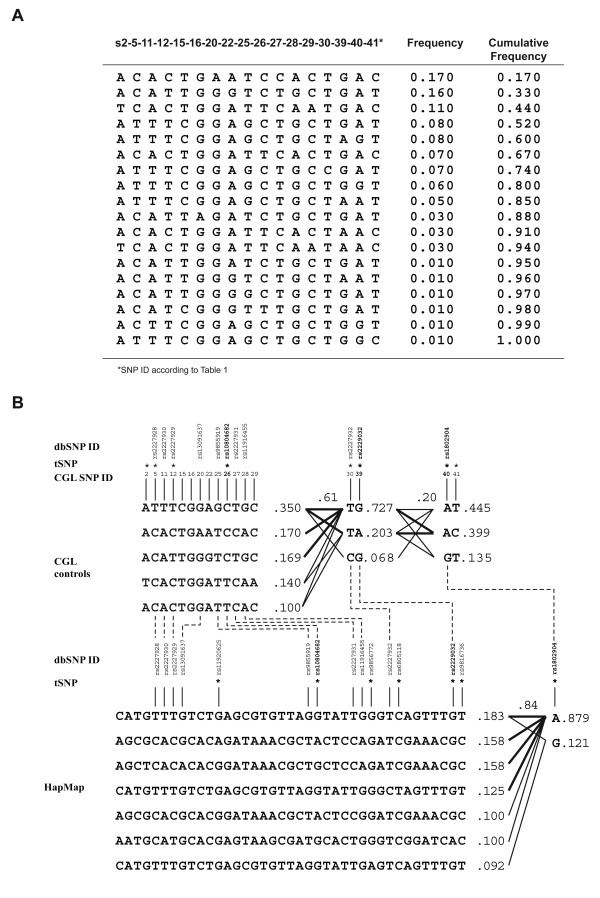
Panel A: The Table denotes the frequencies, using PHASE, of haplotypes using SNPs having a MAF higher than 5% estimated in controls. Panel B: Haplotype blocks predicted using SNPs identified in control series showing a MAF higher than 5% (17 SNPs). tSNPs identified on a block-by-block basis are denoted with an asterisk (*) above the SNP number. Population haplotype frequencies are displayed on the right of each haplotype combination while the level of recombination is displayed above the connections between two blocks. Thick connections represent haplotypes with frequencies higher than 10% while frequencies below 10% are represented by thin lines.