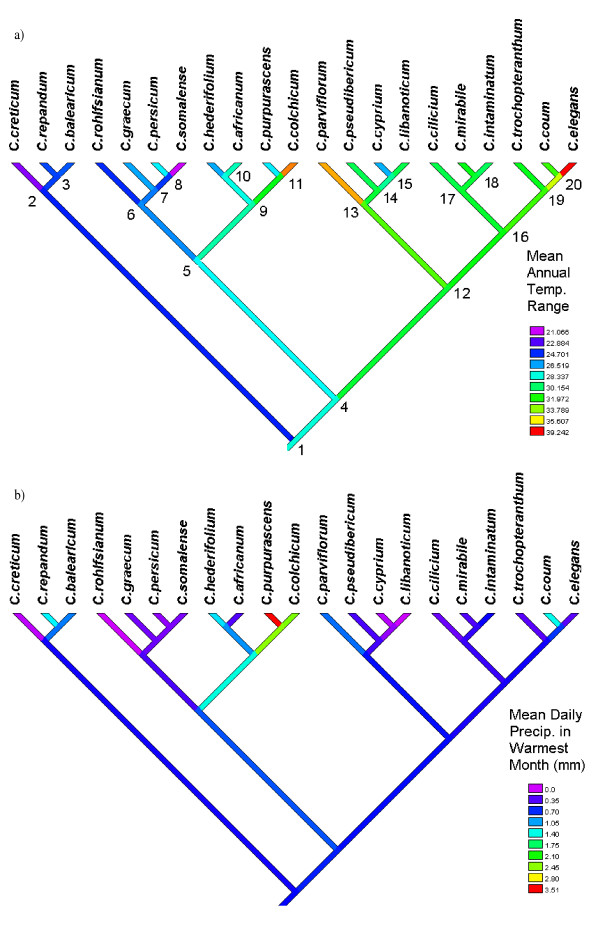
Figure 7.
Phylogeny of Cyclamen. Phylogeny of Cyclamen with square change parsimony optimisation of a) Mean Annual Temperature Range (°C), performed in Mesquite [59] (QVI = 0.37)*. b) Mean daily precipitation in the warmest month (QVI = 0.26)*. Internal node numbers marked for reference. * Both variables show QVI significantly different from random.

