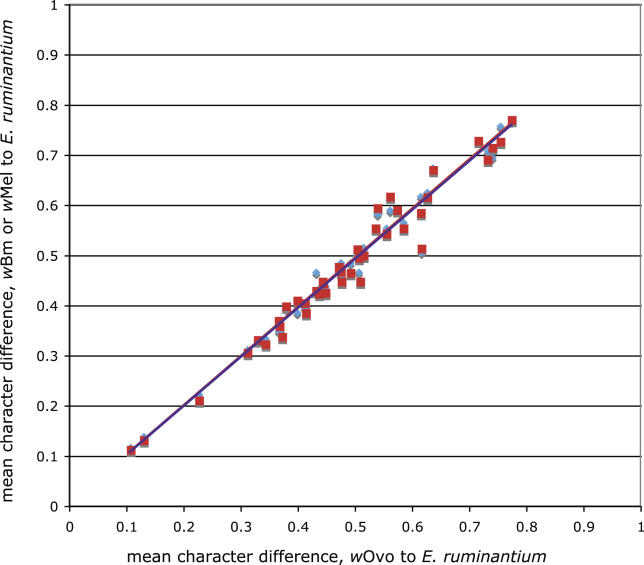
Figure 4. The wOvo Genome Has Similar Evolutionary Rates to wMel and wBm.
The graph shows the relationship between evolutionary rates (mean difference) for all 46 protein-coding genes, calculated as distance to the outgroup E. ruminantium, between wOvo and wMel (red) and wOvo and wBm (blue). For both comparisons, the slope of the line is ≅1 (wOvo/wMel 0.977 ± 0.002; wOvo/wBm 0.981 ± 0.002), indicating that while wOvo has a lower rate than that of the other Wolbachia the difference is minor (~2% overall).

