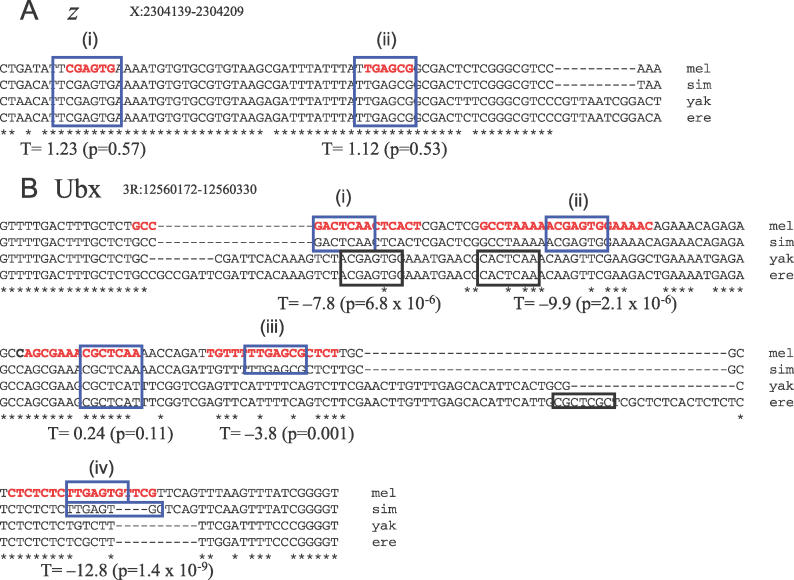
Figure 3. Evolution of Zeste Binding Sites in the z and Ubx Promoters.
(A) Two experimentally characterized [37] Zeste binding sites in the z promoter for which we cannot reject the hypothesis that the binding sites are evolving under the HBZ model using the T statistic.
(B) Four experimentally characterized [34–36] Zeste binding sites the Ubx promoter for which we can reject the hypothesis that the binding sites are evolving under the HBZ model using the T statistic. In the species missing orthologous binding sites for (i) and (ii), we find predicted Zeste binding sites on the opposite strand in approximately the same locations, consistent with compensatory evolution. For (iii) and (iv) there are no such obvious replacements, suggestive of lineage-specific evolution.
T values and associated p-values are indicated beneath each binding site. Bold, red type indicates the region bound by Zeste in vitro in footprinting assays. Blue boxes indicate matches to the Zeste matrix. Black boxes indicate matches to the matrix not found in D. melanogaster.
ere, D. erecta; mel, D. melanogaster; sim, D. simulans; yak, D. yakuba.

