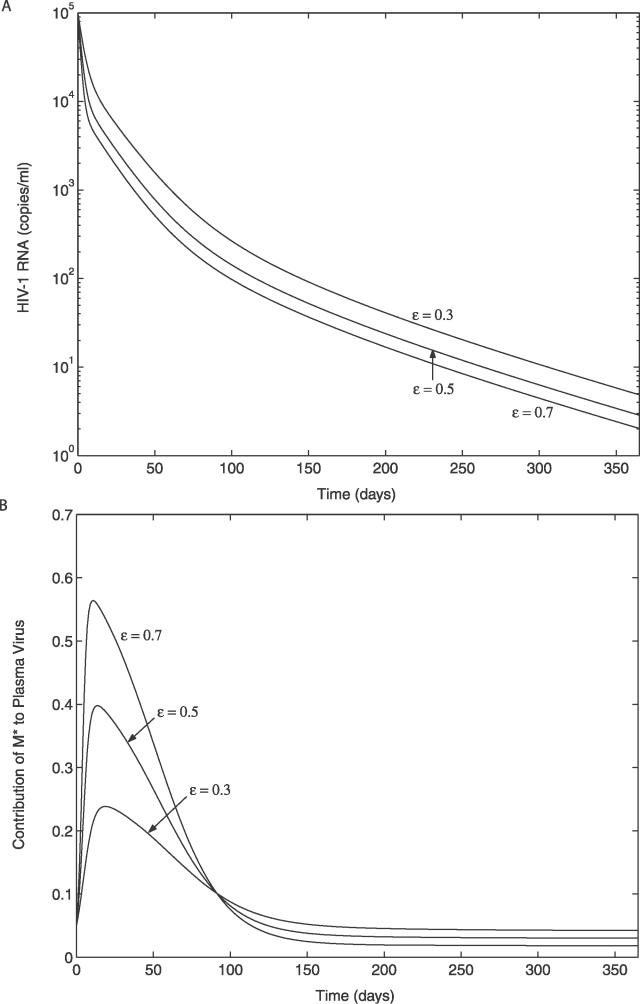
Figure 6. Simulated Decay Dynamics of HIV-1 after the Initiation of ART.
The initial conditions and parameters used in the simulation are given in Materials and Methods. The results are shown for three different drug efficacies (ɛ = 0.3, 0.5, and 0.7).
(A) Viral decay profile.
(B) Contribution of long-lived infected cells to plasma virus (φ1(t) = pMM*(t) / (NδT*(t) + pMM*(t))).

