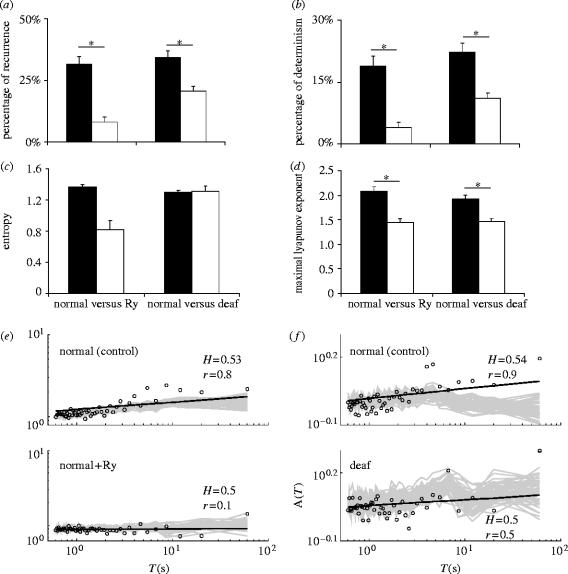
Figure 4.
Recurrence quantification analysis summary for mIPSCs from normal and deaf mice, and following ryanodine. (a) Mean %recurrence, (b) mean %determinism, (c) mean entropy and (d) mean maximal Lyapunov exponent for normal mice control (black bars, left) and following addition of ryanodine (white bars, right); normal (black bars, left) versus deaf mice (white bars, right). (e) Logarithmic Allan factor (A(T) versus T—see text for details) plots of a normal mouse cell before (mIPSC frequency=1.4 Hz; top) and after ryanodine addition (mIPSC frequency=1.4 Hz; bottom). Grey traces represent Allan factors calculated from 100 sets of surrogate data. (f) Same as (e), but the top graph shows a normal mouse cell (mIPSC frequency=1.8 Hz) while the bottom shows a deaf mouse cell A(T) versus T plot (mIPSC frequency=1.9 Hz). (*) denotes significant difference (p<0.05).

