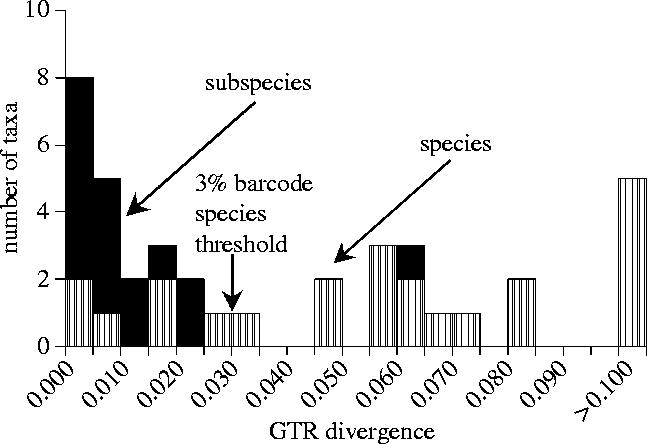
Figure 3.

Histogram of fitted GTR+I+G distances across nodes between subspecies and species in the rate-smoothed tree (figure 2). These distances are similar to (and calibrated using) traditionally measured average pairwise between taxon GTR+I+G distances, except that each node is only recorded once to avoid duplication of information.
