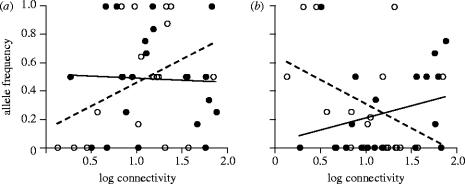
Figure 2.
The frequencies of the alleles (a) pgi-d and (b) pgi-f as functions of population connectivity. Filled circles represent old populations, open circles new populations. Solid and dotted lines are least-square fits for old and new populations, respectively. The interaction between population age and connectivity was significant (pgi-d: p=0.049; pgi-f: p=0.013; table 2).

