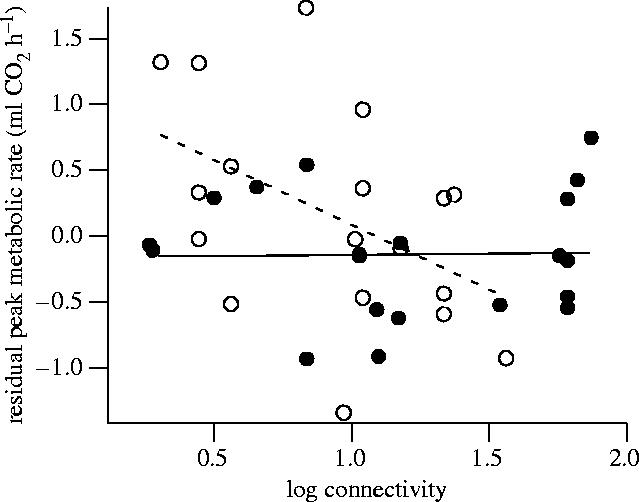
Figure 4.

Residual peak metabolic rate as a function of population connectivity in females from new populations (open circles) and old populations (filled circles). Residuals are from a regression accounting for the effect of body mass. Solid and dotted lines are least-square fits for old and new populations, respectively. The interaction between population age and connectivity was significant (p=0.040).
