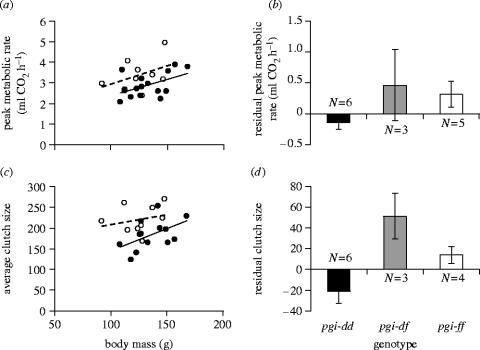
Figure 5.
(a,b) Peak metabolic rate and (c,d) average clutch size of different pgi genotypes. On the left, (a) peak metabolic rate and (c) average clutch size of genotypes with (open circles) and without (closed circles) the allele pgi-f are shown as a function of body mass. Solid and dotted lines are least-square fits for old and new populations, respectively. Differences between genotypes with and without pgi-f were significant (a: p=0.026, c: p=0.010). The panels on the right show (b) residual peak metabolic rate and (d) residual clutch size in the three most common genotypes. Of the pairwise comparisons, the differences between pgi-dd and pgi-ff and between pgi-dd and pgi-df in (d) were significant (p=0.021 and p=0.006, respectively). All other direct comparisons had p>0.14. Note, however, the low power due to small sample sizes.

