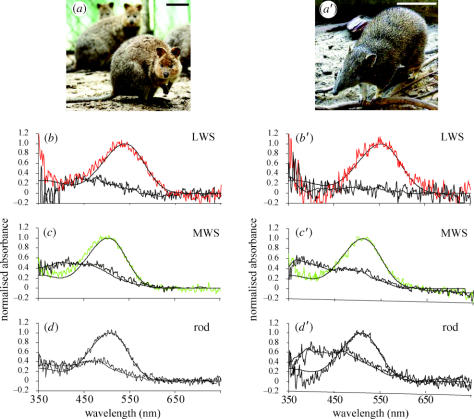
Figure 3.
The diprotodont quokka (a) and polyprotodont quenda (a′). Normalized mean averaged absorbance spectra of visual pigments in the quokka (b–d) and quenda (b′–d′), showing pre-bleach spectra (upper traces) with best-fitted visual pigment templates (solid lines) and post-bleach spectra (lower traces) with running averages (solid lines). Scale bar, 10 cm.

