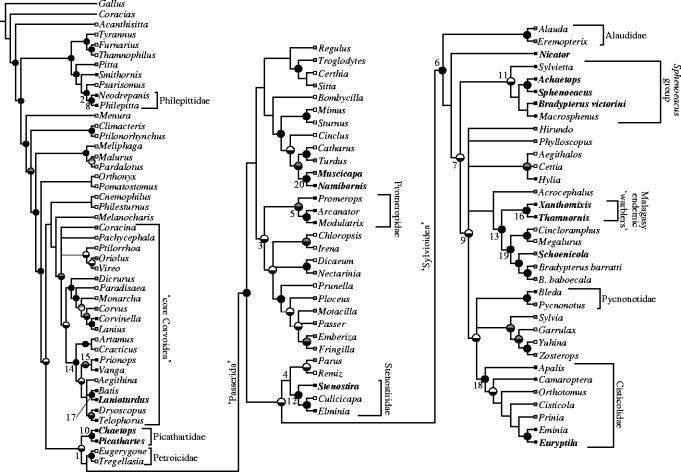
Figure 1.
Relationships among passerines from combined analyses of the nuclear RAG-1 and RAG-2 genes. Presented is the strict consensus of 481 equally parsimonious trees obtained under equally weighted parsimony (see table 2 for summary statistics), with the addition of four nodes not retained in this consensus, but recovered with high estimated Bayesian posterior probability (branches highlighted in grey). Nodal support is indicated by circles, with parsimony bootstrap in the top hemisphere (grey: 75%≥BP<90%; black: BP≥90%) and estimated Bayesian posterior probability in the lower (shaded black if PP≥0.95, otherwise white). Focal taxa in table 1 are highlighted in bold, and numbered nodes correspond to table 3. For illustrative purposes, the distribution of sampled genera is indicated by terminal boxes (white: outside of Africa; grey: distributed both within and outside of Africa; black: endemic to Africa); however, current taxon sampling precludes quantitative biogeographical analyses of the order at this level of resolution.

