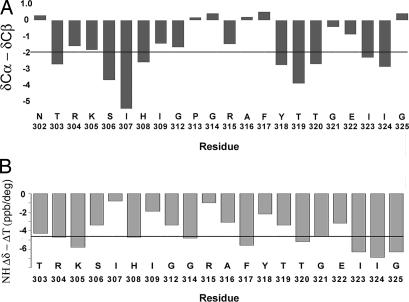
Fig. 2.
The difference between the deviations of δCα and δCβ from random coil values (ΔCα-ΔCβ) and temperature coefficients for each of the V3JR-FL residues. (A) (ΔCα-ΔCβ) are represented by vertical bars. The horizontal line denotes a threshold value of −2 ppm. Consecutive residues with values less than −2 ppm indicate existence of a β-strand conformation (8). (B) The temperature coefficients of each residue are displayed as bars. The horizontal line represents a threshold value of −4.6 ppb/K. Values greater than −4.6 ppb/K are indicative of protection from solvent exchange. Residues N302 and P313 are not included in B.

