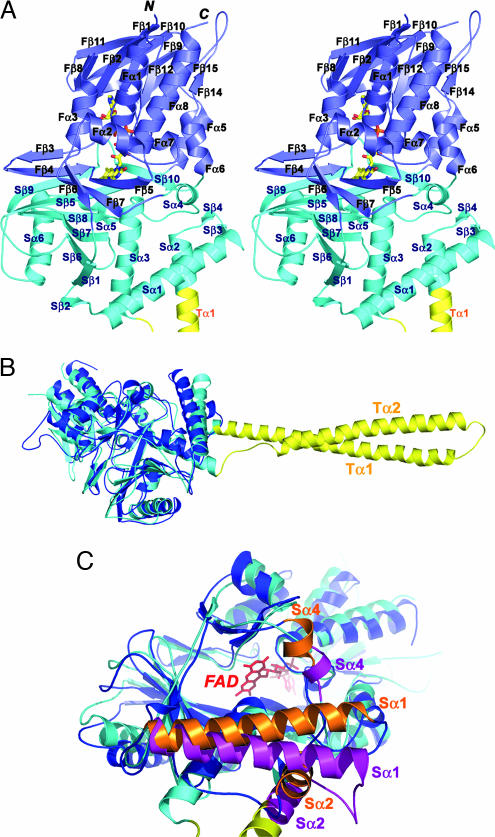
Fig. 3.
The structure of the AOL domain. (A) Stereo ribbon diagram of the AOL domain of LSD1. The molecule is colored as in Fig. 1B. The FAD is in ball-and-stick representation with carbon colored yellow, nitrogen colored blue, oxygen colored red, and phosphorus colored orange. (B) Superposition of LSD1 (the AOL and the Tower domains) on the structure of PAO. LSD1 is in cyan, and PAO is in blue. The Tower domain of LSD1 is colored in yellow. (C) Superposition of the AOL domain of LSD1 on the structure of PAO highlighting the differences in the catalytic cavity. LSD1 is in cyan and purple, and PAO is in blue and orange. The Tower domain of LSD1 is colored in yellow. The FAD, in red and ball-and-stick representation, lies in the back of the cavity. The positional change of three α-helices (Sα1, Sα2, and Sα4) of PAO relative to those of LSD1 significantly reduces the volume of the catalytic cavity.

