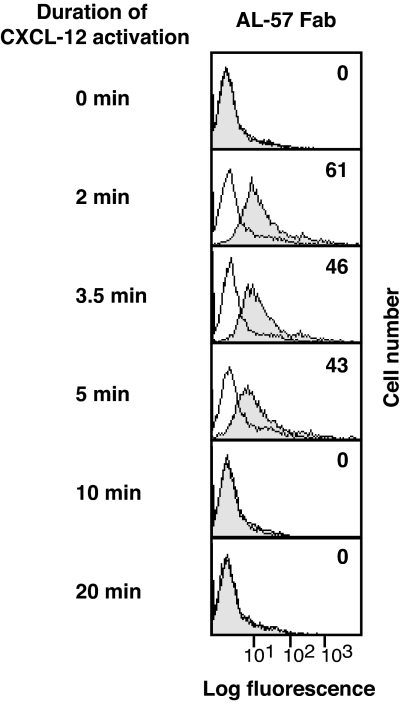
Fig. 4.
The kinetics of LFA-1 activation after stimulation with CXCL-12. Representative histograms for a time course of AL-57 epitope expression are shown. T lymphocytes were stimulated with 50 ng/ml CXCL-12 for the indicated time period. Cells were stained with Fab AL-57 or control Fab labeled with Alexa 488 for 2 min by adding Abs 2 min before the end of stimulation. Cells were then fixed and subjected to flow cytometry. Background staining with control Fab is shown in the open histograms. Numbers within the panels show specific mean fluorescence intensity values for Fab AL-57. At 0, 10, and 20 min, differences between AL-57 Fab and control Fab binding are hardly visible.

