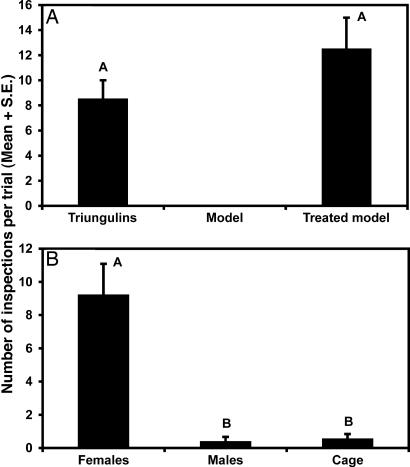
Fig. 2.
Results of bioassays to characterize the nature of male bee attraction to triungulin aggregations or female bees. (A) Male bee inspection visits of triungulin aggregations, visual models of aggregations, and models treated with extracts of triungulins (n = 3) (χ2 = 1.53, P = 0.22). Visual models received no visits and were not included in the data analysis. (B) Inspection visits of male bees to caged female bees, caged male bees, and empty cage controls (n = 9). Two-way ANOVA: treatment, F = 27.45, P = 0.0001, df = 2,17; trial, F = 1.63, P = 0.024, df = 5,17. Bars marked by different letters are significantly different (Student–Newman–Keuls procedure, P < 0.05).

