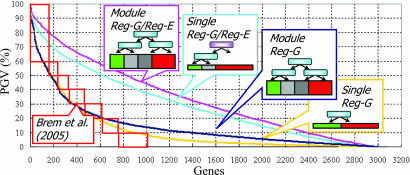
Fig. 1.
Explaining variance of gene expression. The PGV is explained by detected regulation programs for Geronemo (pink) and three simpler variants of Geronemo and for the eQTL analysis of Brem and Kruglyak (red boxes) applied to the same data set as reported in their paper (16). The graph shows the PGVg values (y axis) of 3,152 genes (x axis). The genes (x axis) are sorted by their PGVg, shown on the y axis. The simpler variants of Geronemo consist of: (i) allowing only markers as genetic regulators (ModuleReg-G; blue), (ii) forcing each gene to form a separate module (SingleReg-G/Reg-E; sky blue), and (iii) both of the constraints (SingleReg-G; yellow). A significant advantage is obtained by explicitly modeling regulatory effects by the expression values of regulators, and module-based models show higher PGV than the corresponding single gene-based models. Note that the module-based models identified more genetic regulators per gene than the single gene-based model (ModuleReg-G/Reg-E: 5.25; ModuleReg-G: 6.09; SingleReg-G/Reg-E: 1.36; SingleReg-G: 2.14). Importantly, because of the sharing of parameters between genes in a module, the Geronemo model actually has fewer estimated parameters than the method of Brem and Kruglyak despite allowing for rich combinatorial regulation programs. This result suggests that the module-based model achieves greater statistical power by using fewer parameters, both by correctly linking more genes and by recovering more intricate combinatorial interaction.

